
Technical analysis of XAUUSD today. Gold regained some of its luster at the start of this week’s trading, following a wave of declines that brought it to a strong support level, recording a clear rebound from the $2,293 per ounce area. This move comes as markets await important US economic data this week, particularly those related to inflation, which often directly impact gold’s movements as a safe-haven asset.
Technical analysis of XAUUSD today: Technical Overview
Gold is currently in a short-term uptrend, trading near the $2,310 level after a clear break of the $2,302 resistance level. This positive price action is supported by upward momentum following strong consolidation in the demand zone between $2,287 and $2,293. If the momentum continues, the price is likely to reach stronger resistance areas later.
Technical Indicators Analysis
The 20- and 50-hour moving averages have been successfully breached, and the price is consolidating above them, supporting the bullish scenario. The MACD indicator has recorded a positive crossover in the positive zone with expanding bullish bars, while the Stochastic indicator is showing overbought signs, which may indicate a slight technical correction before the upward trend continues.
Technical Indicators Analysis
- Moving Averages: Bullish crossovers between the short-term averages (EMA 9 and 21) and the medium-term average (EMA 50) confirm the short-term uptrend.
- MACD: Reflects a positive divergence with a clear expansion of the histogram above the zero line, indicating strong momentum.
- Stochastic indicator: It has entered the overbought zone (above 80), indicating a possible correction before the upward trend continues.
Expected Scenarios for Gold Today
Bullish Scenario:
If gold succeeds in maintaining above $2302, the next target will be $2317, followed by $2325, which are key short-term resistance areas. A steady break of $2325 will open the way towards $2335 in the short term.
Bearish Scenario:
If gold fails to maintain $2302, we may witness a downward correction towards $2293. If this support is broken, the next area to be tested will be $2287, which represents the lower limit of the current rebound. A break above this level heralds a return of selling pressure towards 2270.
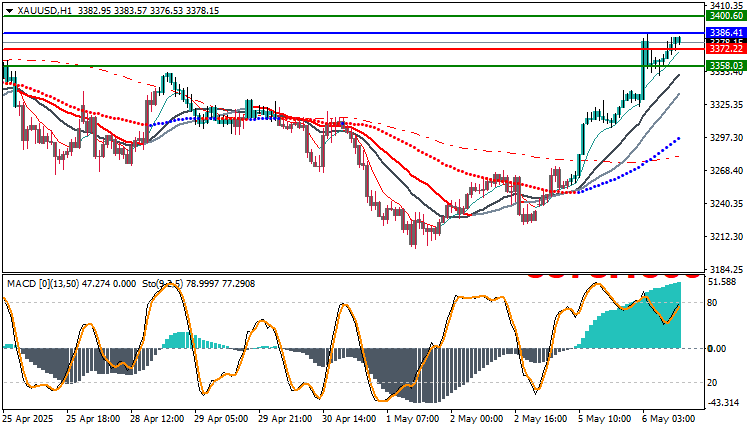
Trading strategies based on Buy/Sell levels
| XAUUSD | In case of buying | in case of selling |
| Entry point | 3386.41 | 3372.22 |
| Target Point 1 (TP1) | First resistance: 3400.60 | First support: 3358.03 |
| Target Point 2 (TP2) | Second resistance: 3412.00 | Second support: 3348.03 |
| Stop Loss (SL) | 3372.22 | 3386.41 |
Gold is moving in a clear positive range with attempts to extend technical gains after breaching the 2302 level, but it still needs to breach 2317 and 2325 to confirm the upside and target higher levels. Any decline below 2293 will tip the balance in favor of sellers. Therefore, traders are advised to closely monitor price action around key support and resistance levels as the US inflation data approach.
Key Data This Week:
- The US Consumer Price Index (CPI) due on Thursday will largely determine interest rate expectations and, consequently, gold movements.
- Any comments from Federal Reserve officials regarding monetary policy could abruptly change the market’s tone.


