
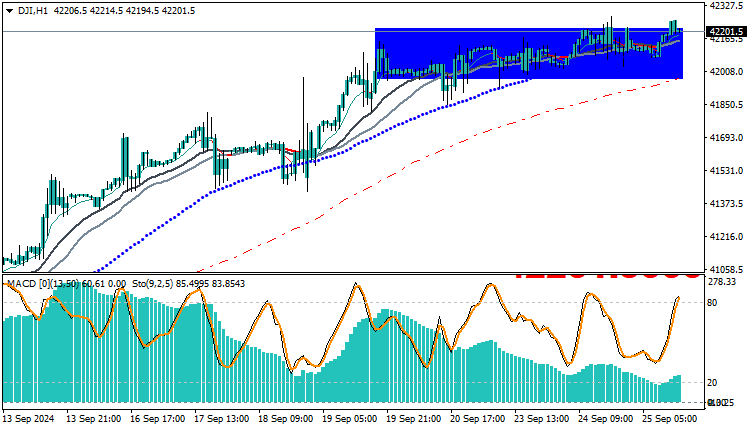
The Dow Jones 30 Index continues to move within a sideways range between the $24,220 and $42,000 levels, as it is currently trading at $42,201. Despite this sideways range, the index is showing positive signs as it is trading above the moving averages’ crossovers.
indicating a general stability in the trend. Moreover, the MACD indicator is reinforcing this trend by showing strong signs of purchasing power, which may open the door for additional upside in the coming period.
Technical Analysis of the Dow Jones 30 Index: Technical Outlook
Technical data shows that the Dow Jones 30 Index is currently trading above the major moving averages, such as the 50- and 200-day moving averages. These averages act as strong support for the index, helping to maintain the positive trend in the short and medium term. This situation indicates that the market continues to consolidate above the major support levels.
In addition, the MACD indicator is showing a positive crossover above the signal line, indicating the continuation of the buying momentum. This supports the expectations that the index will remain in an upward trend in the short term, especially if it is able to break the sideways range to the upside and surpass the key resistance level at 42,000.
If the index is able to break this level, we are likely to witness an additional rise towards new levels that may reach $43,000. However, if it is unable to break this level, the index may return to test the lower support levels in the sideways range, such as the $41,000 level.
How does the MACD indicator affect the future?
With the MACD continuing to trade above the signal line, the index is expected to maintain its upward momentum. As long as this positive crossover continues, the index can continue to achieve additional gains. However, if the index witness’s weakness in the MACD and a negative crossover occurs, this may cause downward pressure and indicate the possibility of the index entering a corrective movement.
Trading strategies based on Buy/Sell levels
| US30 | In case of buying | in case of selling |
| Entry point | 42220 | 42000 |
| Target Point 1 (TP1) | First resistance: 42300 | First support: 41980 |
| Target Point 2 (TP2) | Second resistance: 42380 | Second support: 41910 |
| Stop Loss (SL) | 42000 | 42220 |
The Dow Jones 30 is showing positive signs as it continues to trade above its moving averages and the MACD confirms the purchasing power. If the index manages to break the resistance level at 42000, we are likely to see additional upside. However, beware of any dip in the MACD which could indicate a possible downside correction.


