
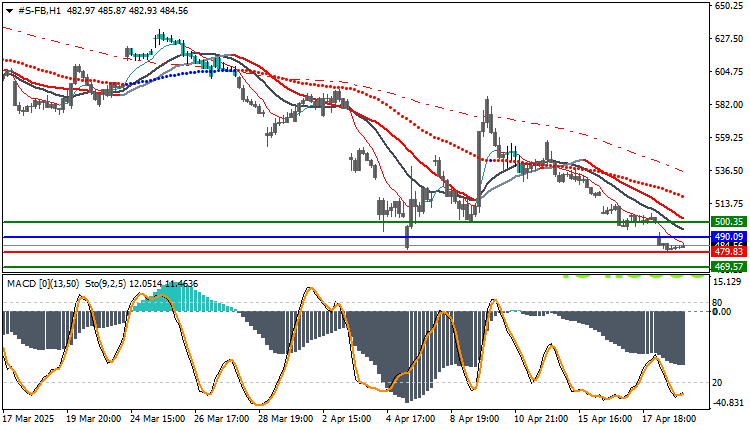
Meta stock has been trading on a clear downward trend since mid-March 2025, as the price has failed to settle above the moving averages, indicating continued selling pressure in the short term.
Moving Averages:
- The price is below all major moving averages (20, 50, 100, and 200), which supports the downward trend.
- The moving averages are arranged in a classic downward pattern, reflecting complete seller control.
Momentum Indicators:
- The MACD remains in negative territory without bullish crossovers.
- The Stochastic is moving near oversold areas without a decisive upward breakout.
Technical Levels:
- Current Support: 479.85 – 469.57
- Nearby Resistance: 490.09 then 500.35
Possible Scenarios:
Positive Scenario (Rebound):
- If the price stabilizes above the support level of 469.57 with the appearance of reversal candles or positive crossovers from indicators (especially Stochastic), we may witness an upward rebound towards the resistance level of 490.09 then 500.35.
- A steady break of 500.35 may return the stock to test the 513.75 area.
Negative Scenario (Continued Downward Trend):
- If a clear break of the 469.57 level and a strong close below it with a candlestick, this would confirm the continuation of the decline, and the stock may target new support areas near 460.00 then 445.00, respectively.
- Continued negative indicators without a rebound would support this scenario.
Trading strategies based on Buy/Sell levels
| Facebook Stock | In case of buying | in case of selling |
| Entry point | 490.09 | 479.83 |
| Target Point 1 (TP1) | First resistance: 500.35 | First support: 469.57 |
| Target Point 2 (TP2) | Second resistance: 510.00 | Second support: 459.00 |
| Stop Loss (SL) | 479.83 | 490.09 |
Based on current technical data, Meta stock movements are contingent on price reaction at the pivotal levels mentioned above. A breakout or breach of these levels will direct price action over the coming sessions, whether towards resuming the downtrend or beginning an upward correction.
However, it is always advisable not to rely solely on technical analysis, especially given the significant impact of economic news on the market.
The most important expected economic influences that may affect stock performance:
- US inflation data (CPI – PPI)
- Federal Reserve interest rate decisions and forecasts
- Labor market reports (NFP – unemployment benefits)
- Corporate results from major technology companies, especially during earnings seasons
- Any surprise statements from Federal Reserve officials or changes in monetary policy


