
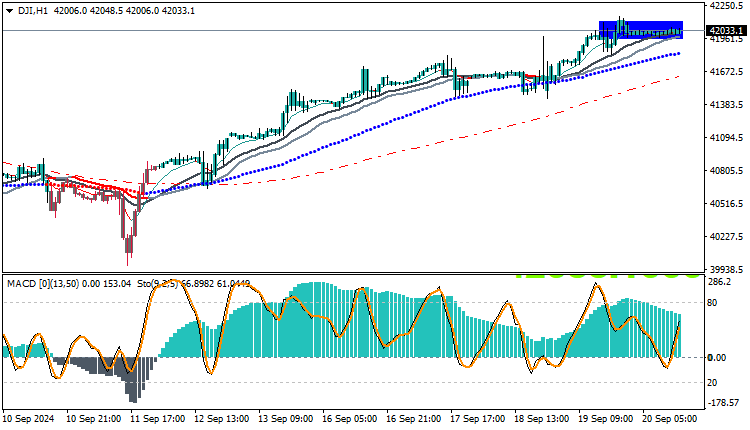
The Dow Jones 30 Index is currently entering a sideways trend between two key areas, 42080 and 41950, as it is currently trading at $41033. While the index is above the moving averages’ intersections, the technical data indicates some weakness in purchasing power, which opens the way for further analysis on the future of the index in the coming period.
Technical Analysis of the Dow Jones 30 Index: Technical Outlook
On the daily chart, the Dow Jones 30 Index appears to be trading in a clear sideways range, which means that prices are still confined between support and resistance levels. Although the index is trading above moving averages such as the 50 and 100-day averages, the lack of a clear trend may lead to price fluctuations.
The MACD indicator reveals weakness in purchasing power, as the two lines are converging, indicating a decline in positive momentum. This reflects the inability of buyers to push prices towards higher levels, which increases the likelihood that the index will continue to trade within the sideways range.
Indicators Expectations
- MACD indicator: indicates a weakness in the buying momentum, which increases the likelihood of the sideways trend continuing or even correcting.
- Relative Strength Index (RSI): is trading near 50 levels, reflecting a state of stability, with the possibility of market volatility.
- Moving Average Indicators: support the sideways trend, as the averages converge without a clear indication of a shift towards the upside or downside.
Trading strategies based on Buy/Sell levels
| US30 | In case of buying | in case of selling |
| Entry point | 42080 | 41950 |
| Target Point 1 (TP1) | First resistance: 42150 | First support: 41880 |
| Target Point 2 (TP2) | Second resistance: 42220 | Second support: 41810 |
| Stop Loss (SL) | 41950 | 42080 |
Based on the current technical analysis, the Dow Jones 30 appears to be in a sideways trend with signs of weak buying power. If this pattern continues, the index could remain confined between $41000 and $41950. The support level at $41000 should be monitored, as it could be a retracement point if the index faces downward pressure.


