
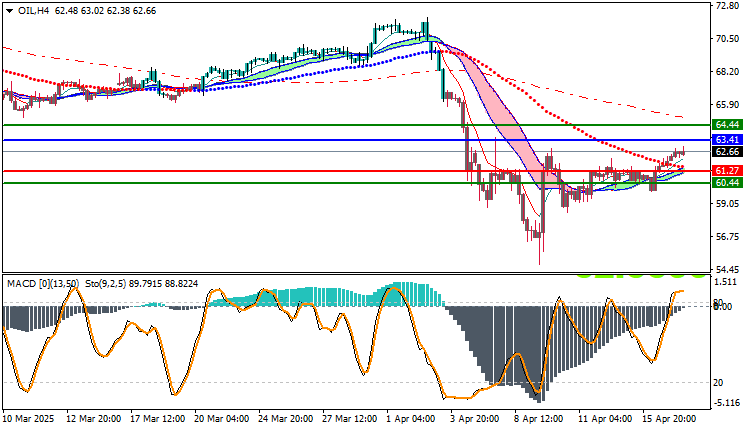
US WTI crude oil experienced a sharp decline in early April, falling from $70 to below $59, due to market concerns about slowing global demand and rising US inventories. However, technical indicators on the H4 chart support the possibility of a gradual recovery from the recent low.
Current Oil Price Situation
- Current Price: $62.65 per barrel
- General Trend: Gradual Recovery from the Decline
- Price Range: 60.44 – 64.44
- Technical Catalyst: Breaking the descending moving averages and closing above 61.27
Nearest Support: 61.27
Most Important Resistance: 64.44
Positive Sign: Bullish Crossover of the moving averages, with increasing momentum in the trend indicators
Technical Analysis of WTI Crude Oil
General Trend:
Oil has begun to form a reversal bottom after a period of price collapse, and technical indicators point to a continuation of the upward correction.
Technical Indicators:
- MACD: Showing a strong bullish crossover, supporting the continuation of positive momentum.
- Stochastic: In overbought areas, which calls for caution against a short-term correction.
- Moving Averages: The price has surpassed the 50-day moving average and is approaching the 200-day moving average, a strong indicator of a trend reversal.
Technical Outlook for Today’s Trading
If the price succeeds in closing above 63.40, we are likely to see a direct target of 64.44, supporting the short-term bullish scenario. However, if the price fails to break this barrier, we may see some decline to the 61.50-61.20 areas as a retest of support before a new upward attempt.
Probable Scenario: Continuation of gradual rise towards 64.44
Alternative Scenario: Limited downward correction to test the 61.27 support level
Trading strategies based on Buy/Sell level
| USOIL | In case of buying | in case of selling |
| Entry point | 63.41 | 61.27 |
| Target Point 1 (TP1) | First resistance: 64.44 | First support: 60.44 |
| Target Point 2 (TP2) | Second resistance: 65.00 | Second support: 59.10 |
| Stop Loss (SL) | 61.27 | 63.41 |
With improving technical indicators and increasing positive momentum, WTI crude oil appears to be on its way to recovering some of its recent losses, but the final decision will depend on the strength of the breakout between 63.40 and 64.44.
Traders are advised to monitor price action near these areas while managing risk carefully, especially given the ongoing geopolitical volatility and the US dollar’s price, which directly impact oil prices.


