
The US dollar fell sharply against its Canadian counterpart over the past week, following improved oil prices (which support the Canadian dollar) and better-than-expected Canadian employment data.
The US dollar came under additional pressure due to stable inflation data that reduced the likelihood of an interest rate hike, but there are currently indications of an attempt at a technical upward correction after reaching strong support levels at 1.3825
Technical Indicator Analysis
Moving Averages
Price below the three moving averages
The trend is still bearish, but we notice a bullish crossover forming on the 20 and 50 EMAs.
A bearish crossover is imminent if the pressure continues
MACD
A bullish crossover is about to occur
The first positive momentum signal since the beginning of the decline
Stochastic
Crossing the 60 area upwards
Signal of a continuation of the short-term corrective momentum.
Possible Scenarios
Bullish Scenario
A break of 1.3895 enhances the chances of a rise towards 1.3920 and then 1.3940
It is preferable to enter after confirmation with a strong candle above 1.3895
Bearish Scenario
A failure at resistance may return the price to test 1.3840 and then 1.3825
A break of 1.3825 will resume the decline towards 1.379
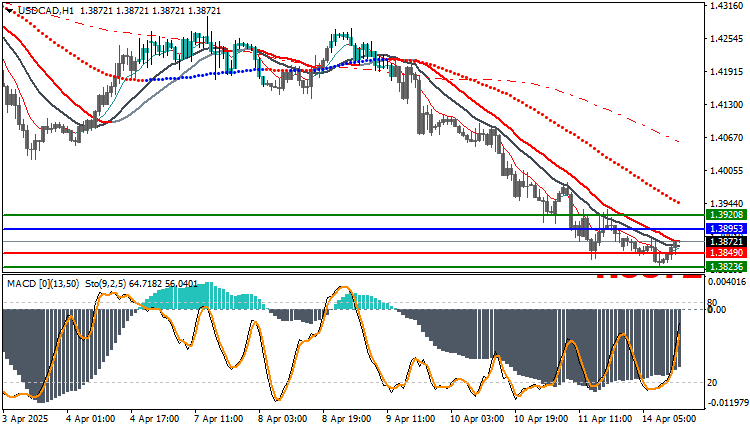
Trading strategies based on Buy/Sell levels
| In case of buying | in case of selling | USDCAD |
| 1.38953 | 1.38490 | Entry point |
| First resistance: 1.39208 | First support: 1.38226 | Target Point 1 (TP1) |
| Second resistance: 1.39446 | Second support: 1.38002 | Target Point 2 (TP2) |
| 1.38490 | 1.38953 | Stop Loss (SL) |
The USD/CAD pair is showing signs of a potential technical rebound after an extended sell-off.
A clear break above 1.3895 will change the short-term trend to an upside, while a failure will re-establish selling pressure.
Traders are advised to closely monitor price action at 1.3895 with a stop-loss below 1.3840.


