
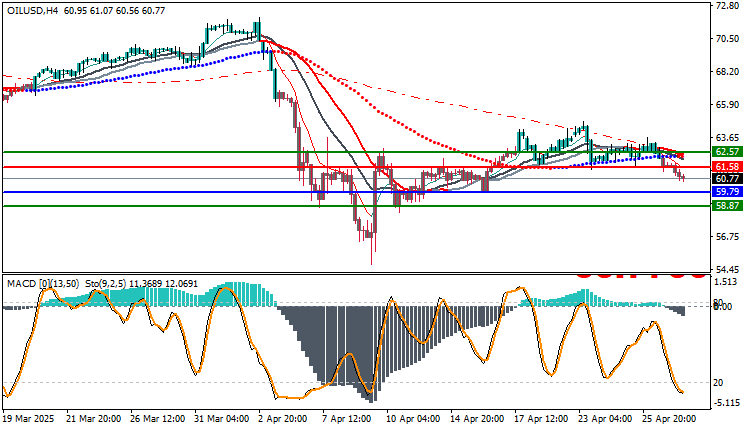
Technical Analysis for OIL/USD : Oil prices are under pressure due to: a larger-than-expected rise in US crude inventories, weaker Chinese energy demand, and a decline in geopolitical concerns after a temporary lull in tensions. All of this contributed to strengthening the downward correction from the 63.65 level.
OIL/USD : Technical Indicator Analysis
Moving Averages
The price is below all averages (50, 100, and 200).
Continued negative crossovers since the beginning of April.
MACD
accelerating negative momentum. Negative bars are increasing.
Stochastic:
Near oversold (around 12).Possibility of a slight rebound, but without real reversal indicators.
Bearish Scenario (Strongly Likely):
A break of 60.77 opens the way towards 59.79 and then 58.87.
Continued momentum supports this scenario.
Bullish Scenario (Temporary Corrective):
A rebound from 60.77 could retest 61.58. A break of 61.58 alone would restore the trend. Thinking about the trend
Trading strategies based on Buy/Sell levels
| In case of buying | in case of selling | OILUSD |
| 61.58 | 59.79 | Entry point |
| First resistance: 62.57 | First support 58.87 | Target Point 1 (TP1) |
| Second resistance 63.00 | Second support 57.00 | Target Point 2 (TP2) |
| 59.79 | 61.58 | Stop Loss (SL) |
Crude oil is on a steady downward trajectory with increasing technical and fundamental pressures. A break of 60.77 would be a strong signal that the decline will resume towards lower levels.
Any rebound would be a temporary selling opportunity as long as 61.58 is not breached.
Recommendation: Sell on a break of 60.77 or a weak rebound below 61.58, with targets at 59.79 and 58.87, and a stop loss above 62.40.


