
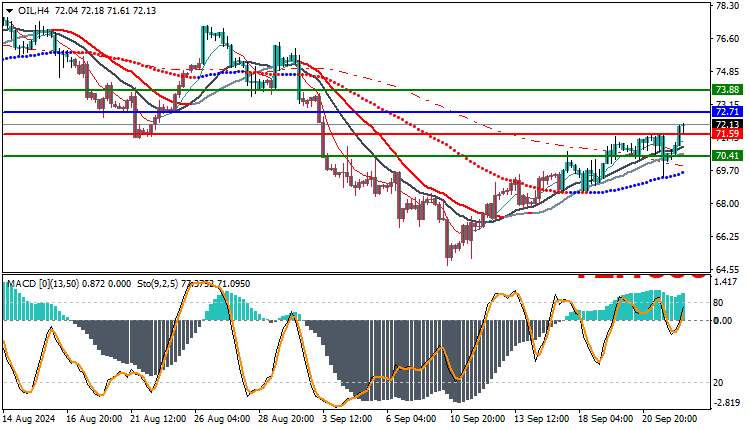
Today, oil is trading at $72.13 per barrel, continuing its upward path on the 4-hour time frame. The price shows significant strength as it moves above the moving averages’ intersections, which supports the continuation of this trend. In addition, the MACD indicator provides positive signals that enhance the possibility of continuing the rise.
Technical Analysis for Oil: The Technical Outlook
The chart shows that oil is maintaining its upward trend, as the price continues to trade above the main support levels represented by the moving averages’ intersections (50, 100, and 200 periods). These intersections are a strong indicator that the market is in a state of continuous support from buyers, which enhances the possibility of continuing the rise in the near future.
Despite some minor corrections that may occur during trading, the general trend is still in favor of buyers. What reinforces this perception is that the MACD indicator shows a positive signal that supports the continuation of the purchasing power, as the MACD line is trading above the signal line in the positive zone.
Indicators Forecast
- MACD: The current positive momentum is strengthening, as the MACD line is trading above the signal line, indicating that the uptrend is still strong and the market may continue to rise in the upcoming sessions.
- Moving Averages: Prices remain above the moving averages, indicating continued support in the short and medium term.
Trading strategies based on Buy/Sell level
| USOIL | In case of buying | in case of selling |
| Entry point | 72.71 | 71.59 |
| Target Point 1 (TP1) | First resistance: 73.88 | First support: 70.41 |
| Target Point 2 (TP2) | Second resistance: 74.80 | Second support: 69.30 |
| Stop Loss (SL) | 71.59 | 72.71 |
Given the current movements of oil and based on the positive technical signals, the uptrend is still dominant. The price is trading above the moving averages crossovers and the continuation of the positive signals from the MACD indicator supports further upward movements. Traders should monitor technical support levels and look for any changes in momentum to determine optimal entry and exit points.


