
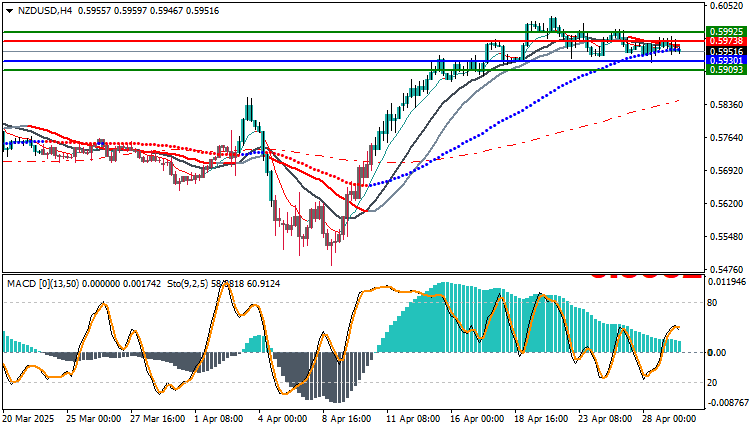
Technical Analysis for NZD/USD : The New Zealand dollar has stabilized in recent sessions after a strong rally supported by improved global market confidence. Awaiting key US economic data (PCE), the pair has entered a period of volatility near a key resistance area.
Technical Indicator Analysis
Moving Averages
The price remains above the three moving averages.
The averages have begun to oscillate sideways, indicating a slowdown in the trend.
MACD
In the positive zone, but gradually losing momentum.
No sharp negative crossovers yet.
Stochastic
Rebound from the mid-range towards 60.
Possible signal of limited upside unless 0.5930 is broken.
Technical Analysis for NZD/USD : Expected Technical Scenarios
Bullish Scenario (likely in case of a breakout):
Breaking 0.5973 opens the way towards 0.5992 and then 0.6020.
Continuity condition is stability above 0.5930.
Corrective Scenario (Alternative):
Breaking 0.5930 returns the price towards 0.5900. Breaking 0.5900 completely weakens the uptrend
Trading strategies based on Buy/Sell levels
| In case of buying | in case of selling | NZD/USD |
| 0.59738 | 0.59301 | Entry point |
| First resistance: 0.59925 | First support: 0.59293 | Target Point 1 (TP1) |
| Second resistance 0.60125 | Second support 0.58893 | Target Point 2 (TP2) |
| 0.59301 | 0.59738 | Stop Loss (SL) |
The NZD/USD pair is moving within a narrow consolidation range above strong support, with a clear slowdown in momentum.
Any break above 0.5973 would signal a resumption of the uptrend, while a break below 0.5930 would temporarily change the outlook to negative.
Recommendation: Buy after a break of 0.5973, or sell after a break of 0.5930 with a tight stop loss.


