
Technical Analysis for NZD/USD : The New Zealand dollar lost some of its recent gains after weaker-than-expected global inflation data prompted investors to scale back bets on continued aggressive monetary tightening.
On the US side, the dollar held steady ahead of key consumer spending data and inflation indicators
Technical Indicator Analysis
Moving Averages
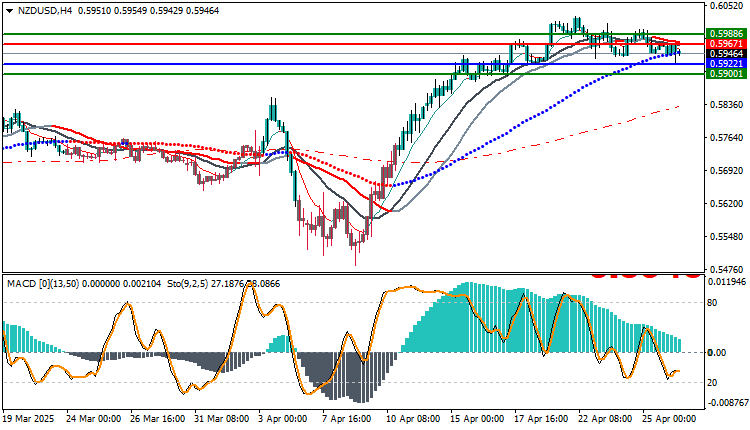
Price is between the moving averages, indicating a slowdown in the trend.
50- and 100-period moving averages are beginning to cross over.
MACD
Positive momentum is declining.
No sharp crossover yet, but weakness is evident.
Stochastic
Moving in a bearish range. Not yet in the oversold zone.
Technical Analysis for NZD/USD : Possible Scenarios
Bearish Scenario (likely):
A break of 0.5922 confirms the continuation of the correction towards 0.5900.
A break of 0.5900 could open the way to 0.5860.
Bullish Scenario (currently weak alternative):
Stable above 0.5946, with a break of 0.5961 retesting 0.5988.
A close above 0.5988 is necessary to resume the uptrend.
Trading strategies based on Buy/Sell levels
| In case of buying | in case of selling | NZD/USD |
| 0.59671 | 0.59221 | Entry point |
| First resistance: 0.59886 | First support: 0.59001 | Target Point 1 (TP1) |
| Second resistance 0.60055 | Second support 0.58952 | Target Point 2 (TP2) |
| 0.59221 | 0.59671 | Stop Loss (SL) |
The NZD/USD pair has lost its upward momentum and has begun an orderly technical correction phase with pivotal support at 0.5922 – 0.5900.
As long as the price remains below 0.5961, downside pressures will remain dominant in the short term.
It is recommended to closely monitor support and enter short on a breakout with a stop loss above 0.5961.


