
Technical Analysis for Gold (XAU/USD) : Gold prices are under corrective pressure as the US dollar consolidates ahead of the release of the Personal Expenditures (PCE) data, the Federal Reserve’s preferred indicator.
The absence of fresh market catalysts increases the likelihood of technical corrections, despite ongoing geopolitical tensions that limit the sharp decline.
Technical Indicator Analysis
Moving Averages
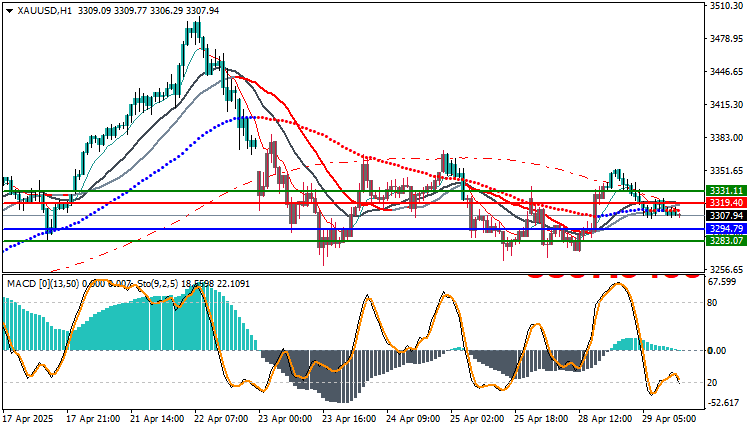
The price is below the 20, 50, and 100 moving averages.
All of these indicate continued downward pressure.
MACD
In the negative zone with weak momentum.
No bullish crossover has yet occurred.
Stochastic
Moving near the oversold zone (below 20).
Possibility of a limited technical rebound before the decline continues.
Technical Analysis for Gold (XAU/USD) : Possible Scenarios
Bearish Scenario (likely):
A break of 3304.71 pushes the price towards 3294.79.
A break of 3294 accelerates the decline towards 3283.07
Bullish Scenario (likely corrective):
A rebound from 3304 could retest 3311. A break of 3311.49 is required to confirm any uptrend.
Trading strategies based on Buy/Sell levels
| In case of buying | in case of selling | XAU/USD |
| 3319.40 | 3294.79 | Entry point |
| First resistance 3331.11 | First support: 3283.07 | Target Point 1 (TP1) |
| Second resistance 3337.20 | Second support 3277.02 | Target Point 2 (TP2) |
| 3294.79 | 3319.40 | Stop Loss (SL) |
Gold is moving in a narrow range with continued downward pressure. Any rebound above 3307 without a break of 3311 represents a temporary selling opportunity.
The trend will not turn positive unless a clear close above 3311.49 is achieved.
Recommendation: Sell on a weak rebound or break of 3304, with targets at 3294 and 3283, and a stop loss above 3315.


