
Gold prices are stable above 3280, supported by geopolitical concerns and a weak US dollar ahead of the release of the Federal Reserve’s favorable inflation data (PCE).
Markets are pricing in a US monetary stabilization scenario, providing some stability for gold despite the recent strong dollar correction.
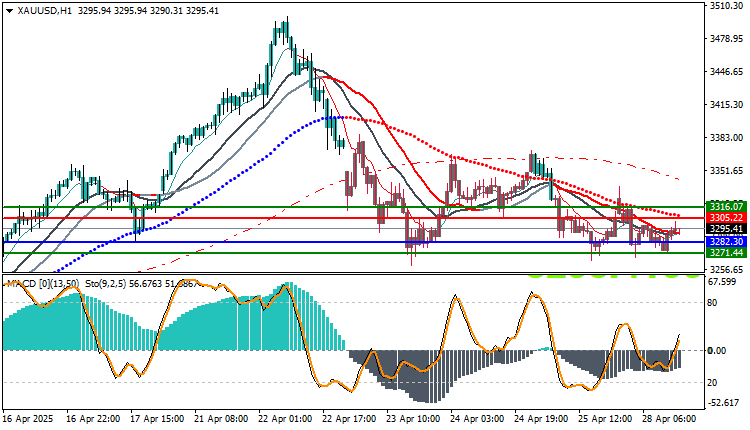
Technical Indicator Analysis
Moving Averages
Price below the 50, 100, and 200 moving averages
Slightly bearish slope confirms the weakness of the uptrend
MACD
Slightly positive but lacks strong momentum No decisive bullish crossover yet
Stochastic
Rising from the 50 levels
Signal of a possible short-term rebound but needs confirmation by a breakout
Technical Analysis for Gold : Expected Technical Scenarios
Bearish Scenario
Failure to break above 3305 could re-pressure 3284
Break above 3284 could accelerate the decline towards 3271
Bearish Scenario
Break above 3305 could re-test 3316
Closing above 3316 would open the way for a target of 3340
Trading strategies based on Buy/Sell levels
| In case of buying | in case of selling | XAU/USD |
| 3305.22 | 3282.30 | Entry point |
| First resistance 3316.07 | First support: 3271.44 | Target Point 1 (TP1) |
| Second resistance 3321.33 | Second support 3278.23 | Target Point 2 (TP2) |
| 3282.30 | 3305.22 | Stop Loss (SL) |
Gold is moving within a sideways channel between 3284 and 3305, with a slight tendency toward technical weakness as long as 3305 is not breached with a strong close.
Any break above 3305 would signal improved bullish momentum.
Recommendation: Close monitoring, sell below 3305, or buy only after a confirmed break above 3305 with a tight stop loss.


