
Gold has been trading sideways in recent hours amid apparent market caution ahead of US GDP data.
Recently rising US bond yields have diminished gold’s appeal as a safe haven, while global geopolitical risks continue to support demand on the decline
Technical Indicator Analysis
Moving Averages
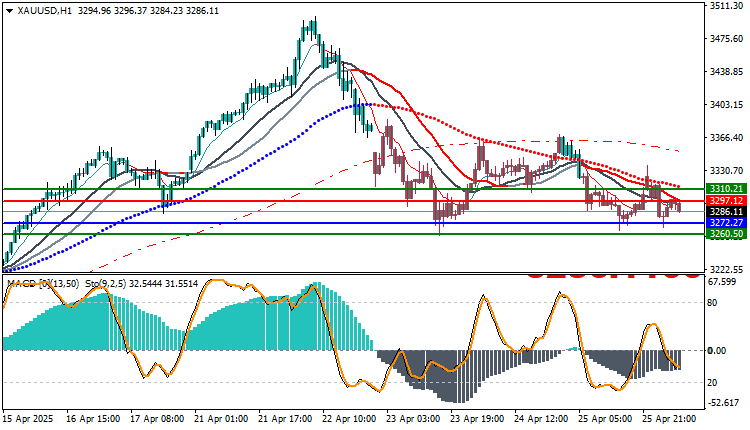
The price is below the 50, 100, and 200 moving averages.
The moving averages are sloping down, indicating continued selling
MACD
In the negative zone, with selling momentum beginning to lose.
A short-term technical rebound may occur.
Stochastic
Moving down from intermediate zones.
No clear oversold conditions currently.
Possible Scenarios
Bearish Scenario (likely):
A break of 3286.11 and then 3277.27 pushes the price to 3260.50.
A break of 3260.50 triggers a new, stronger selling wave
Bullish Scenario (temporary):
A return above 3297.12 could trigger a rise to 3310.21.
A break of 3310.21 is necessary to confirm the end of the downward correction.
Trading strategies based on Buy/Sell levels
| In case of buying | in case of selling | XAU/USD |
| 3297.12 | 3272.27 | Entry point |
| First resistance: 3310.21 | First support: 3260.50 | Target Point 1 (TP1) |
| Second resistance 3317.30 | Second support 3268.20 | Target Point 2 (TP2) |
| 3272.27 | 3297.12 | Stop Loss (SL) |
Gold is moving within a narrow consolidation range above the 3286 support level, with a clear loss of upward momentum.
Any break below 3286 will trigger a sell-off towards lower levels, while a break above 3310 is required to reverse the short-term trend.
Recommendation: Carefully monitor support and resistance levels, while adhering to a strict stop loss for any new entry.


