
Gold has experienced a sharp decline in recent hours following a surprise rise in the US Manufacturing PMI, which restored momentum to the dollar and pressured gold prices as a safe haven.
Profit-taking after hitting new record highs this week also contributed to the sharpness of the correction.
Technical Indicator Analysis
Moving Averages
Price below all three moving averages
Clear bearish crossovers reinforce continued pressure
MACD
Selling momentum at its peak
Strong negative bars show the strength of the breakdown.
Stochastic
N oversold areas (below 30) May precede a slight technical rebound
Technical Analysis for Gold : Possible Scenarios
Bearish Scenario (likely):
Continued pressure towards 3272 then 3255
If 3255 is broken, the decline will be stronger
Bullish Scenario (temporary):
A rebound from 3294.66 may retest 3307 then 3320 However, the general trend will not change until 3338.49 is breached with a clear close
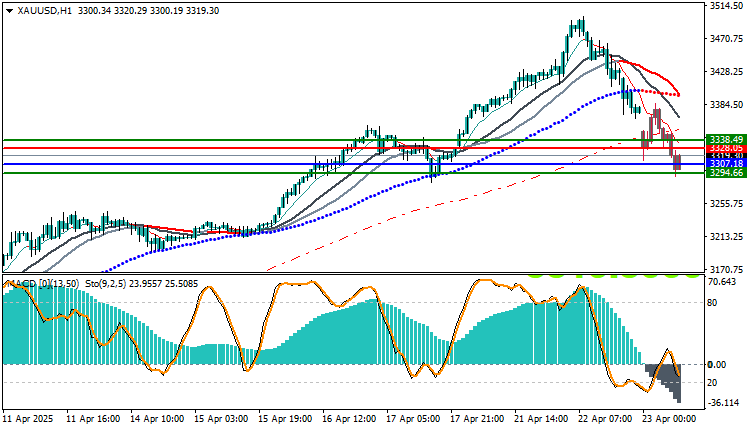
Trading strategies based on Buy/Sell levels
| In case of buying | in case of selling | XAU/USD |
| 3328.05 | 3307.18 | Entry point |
| First resistance: 3338.49 | First support: 3294.66 | Target Point 1 (TP1) |
| Second resistance 3345.23 | Second support 3289.22 | Target Point 2 (TP2) |
| 3307.18 | 3328.05 | Stop Loss (SL) |
Gold is currently undergoing a strong technical correction after reaching higher highs, and selling momentum is fully dominant.
As long as the price is below 3307, the corrective trend will continue in the short term.
Sell trades are recommended on weak rebounds towards 3307 or after a break of 3272, with a stop loss above 3338.


