
S&P500 SPX Technical Analysis: The SP500 Index has witnessed a downward trend since the beginning of the current trading day, recording its highest level at 5611 and its lowest level at 5551. Despite this early decline, the index was unable to continue the downward trend and quickly returned to rise, bringing the current trading price to 5605.
Technical analyses clearly show that the index has started trading above the moving averages, indicating a decline in the effectiveness of selling pressures and their impact on the downward trend. On the other hand, the MACD indicator shows a weakness in the selling force within the negative trend, as intersections have begun to appear indicating the possibility of enhancing positive opportunities for the index.
S&P500 SPX Technical Analysis: Recommendations
- Buy: It is recommended to consider buying opportunities if the index continues to trade above the moving averages and confirms the upward trend.
- Sell: It is possible to postpone any selling decisions until the index shows strong signs of resuming the downward trend
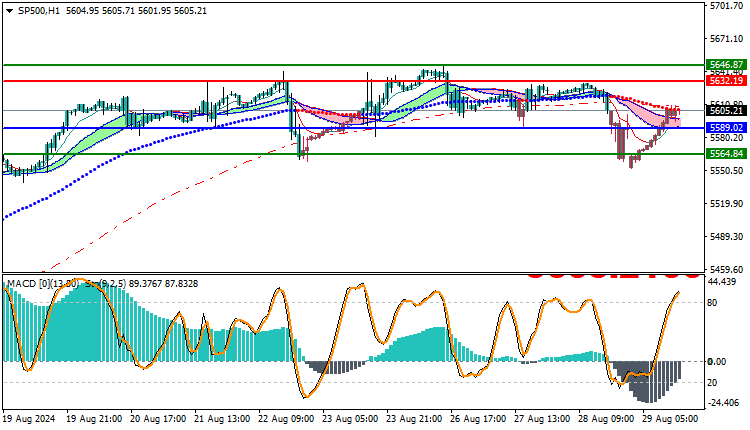
Trading strategies based on Buy/Sell levels
| SP500 | In case of buying | in case of selling |
| Entry point | 5632 | 5589 |
| Target Point 1 (TP1) | First resistance: 5646 | First support: 5564 |
| Target Point 2 (TP2) | Second resistance: 5669 | Second support: 5500 |
| Stop Loss (SL) | 5589 | 5632 |
Technical indicators suggest that the current trend of the SP500 index may change from bearish to bullish, which enhances the chances of benefiting from the positive market movement. It is advisable to monitor the following developments to ensure the continuation of the bullish trend and make trading decisions based on clear technical analysis.


