
Silver Technical Analysis. Silver is currently trading in a general downtrend, trading at $29.51 per ounce, which is below the moving averages, indicating the continuation of the negative momentum. Also, breaking the strong support level at $29.65 per ounce, which has held since last September, reinforces the current downtrend.
Silver Technical Analysis: MACD Forecast:
MACD indicates the continuation of the negative trend for silver, which supports the bearish technical view. However, there is a noticeable divergence between the price movement and the MACD movement, reflecting the possibility of the current negative trend weakening and not continuing for a long time.
We advise:
Given these data, we advise traders to closely monitor price movements during the coming period, as silver may witness a change in the general trend. The current technical analysis suggests caution before making any investment decisions, especially in light of the mixed signals from the MACD indicator.
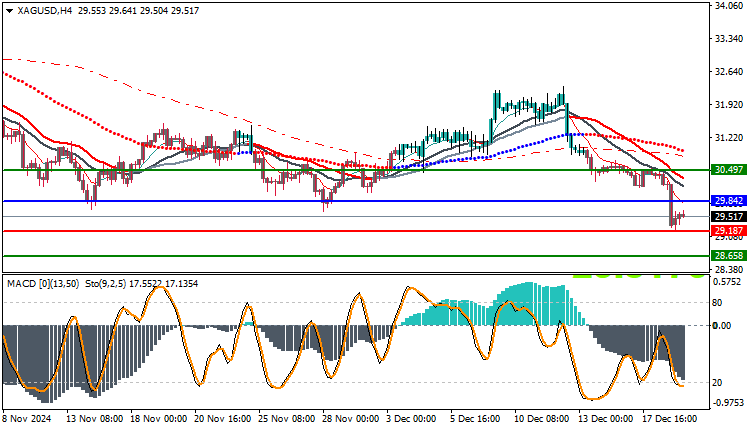
Trading strategies based on Buy/Sell levels
| In case of buying | in case of selling | EURUSD |
| 29.84 | 29.18 | Entry point |
| First resistance: 30.49 | First support: 28.65 | Target Point 1 (TP1) |
| Second resistance: 31.00 | Second support: 38.00 | Target Point 2 (TP2) |
| 29.18 | 29.84 | Stop Loss (SL) |
Based on the current analysis, the downtrend in silver is still in control, supported by the break of key support levels and the price trading below the moving averages. However, the divergence between the price action and the MACD indicator may indicate the near end of the negative momentum and the possibility of reversal signals. We advise investors to be cautious and focus on important support and resistance levels, and follow the confirmation signals from technical indicators before making any trading decisions in the coming period.


