
Facebook Technical forecast. Meta stock (symbol: #S-FB) is showing relative stability near record levels, supported by a buying wave that began at the end of April, successfully crossing the $600 barrier. As traders await the results of the technology sector and the impact of global markets, the stock maintains positive momentum that may pave the way for a new upward wave.
Technical forecast for Facebook stock: Technical overview:
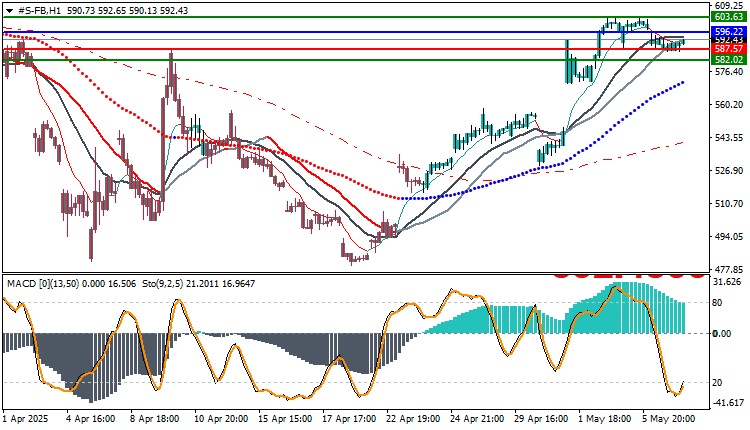
Meta stock is currently trading at $603.40 after a technical break of the $598.65 level, which has turned into strong support over the past two sessions. The stock is moving in a regular ascending channel on the H1 timeframe, with rising highs and lows confirming the continued control of the trend by buyers.
Facebook technical forecast : Technical Indicators Analysis:
- MACD: It continues to move in the positive zone, despite a slight slowdown in the bars, which is normal after a rapid upward wave.
- Stochastic: Approaching overbought territory, but has not yet shown a reversal signal.
- Moving Averages: The price is above the 50-, 100-, and 200-day
Bullish Scenario:
If the price stabilizes above $602.00 during the US session, the next target will be $609.25, a technical resistance level that has been in place since mid-April. A break above this level will open the way to 613.85 as a second target.
Bearish Scenario:
If the stock fails to maintain 602.00, it may retest the support level of 598.65. A break above this support will push the price down toward 593.13, a key short-term support area.
Trading strategies based on Buy/Sell levels
| Facebook Stock | In case of buying | in case of selling |
| Entry point | 596.01 | 587.13 |
| Target Point 1 (TP1) | First resistance: 603.89 | First support: 582.46 |
| Target Point 2 (TP2) | Second resistance: 607.00 | Second support: 572.00 |
| Stop Loss (SL) | 587.13 | 596.01 |
Meta stock continues its strong upward trajectory provided the daily close maintains above 602.00. The key technical levels for tracking the stock’s movement are 598.65 support and 609.25 resistance. Any break or penetration will determine the direction of the trend for the coming period. It is essential for traders to follow this week’s US employment data, which could change the technical equation abruptly. Moving cautiously with flexible stop-loss orders is key at this stage.
Influencing Factors:
- Movements in US technology stocks in general, and earnings results for companies related to artificial intelligence and digital advertising.
- Investor appetite for stocks amidst the instability of other indicators.


