
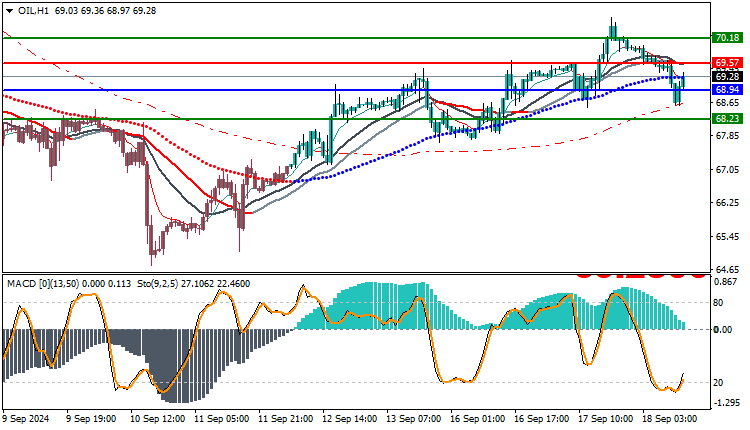
Oil prices are trading today at $69.28 per barrel, with clear signs of weakness in the uptrend. This weakness seems to be due to the anticipation that dominates the markets as the US interest rate decision approaches this evening. The chart shows that the price has started to move away from previous highs, indicating a possible change in trend, especially with the price’s inability to penetrate nearby resistance levels.
Indicators Expectations
Moving Averages: The moving averages indicate weak positive momentum, as the price is trading near those averages without clearly penetrating them. Continued trading below the averages may support the possibility of a bearish reversal in the near term, which requires close monitoring of variables.
MACD Indicator: The MACD indicator is showing signs of weakness in the uptrend, as the gap between the indicator lines has started to gradually narrow, which enhances the possibility of a downward correction in the price if the current weakness continues.
Trading strategies based on Buy/Sell level
| USOIL | In case of buying | in case of selling |
| Entry point | 69.57 | 68.94 |
| Target Point 1 (TP1) | First resistance: 70.18 | First support: 68.23 |
| Target Point 2 (TP2) | Second resistance: 72.80 | Second support: 67.00 |
| Stop Loss (SL) | 68.94 | 69.57 |
Looking at the current technical indicators, it seems that oil may witness a bearish correction in the short term if it fails to regain the bullish momentum. Continued trading below the resistance levels and with weak signals in the moving averages and the MACD indicator may push the price to test the support levels around $68.80.


