
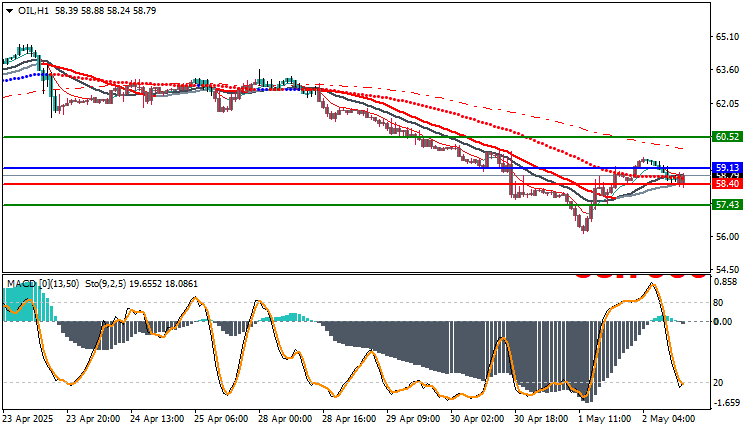
OIL/USD Technical analysis Today: Crude oil made a strong rebound from the 56.00 support level to reach 59.13, but it has so far failed to break through key resistance levels.
The rapid decline in technical momentum could signal the end of the corrective movement and the return of the downtrend.
OILUSD Crude Oil Analysis Today: Technical Outlook
- Price remains below the 200 moving average
- Strong resistance at 59.13, and key support at 57.43
- The general trend is bearish unless 60.50 is broken
Technical Indicator Analysis:
- EMA: Negative crossover, price below all moving averages
- MACD: Positive momentum is beginning to decline
- Stochastic: Declining from near oversaturation levels
OIL/USD Technical analysis Today: Expected Scenarios:
Likely bearish:
- Breaking 58.40 leads to:
- 90
- 43
Alternative bullish:
- Breaking 59.13 could lead to:
- 65
- 50
Trading strategies based on Buy/Sell level
| USOIL | In case of buying | in case of selling |
| Entry point | 59.13 | 58.40 |
| Target Point 1 (TP1) | First resistance: 60.52 | First support: 57.43 |
| Target Point 2 (TP2) | Second resistance: 61.60 | Second support: 56.40 |
| Stop Loss (SL) | 58.40 | 59.13 |
Recovery attempts are beginning to weaken technically, supporting the return of sellers to the market. Any break of 58.40 would bring the bearish scenario back into focus.
Expected Economic Data:
Friday, May 3, 2025:
- US Nonfarm Payrolls (NFP)
- Unemployment Rate
Any surprises in these data could directly impact growth expectations and global demand for oil, which would immediately impact the price.


