
Oil continues to trade within a general uptrend, currently trading at $70.68 per barrel. However, technical data indicates a weakness in the upside momentum, which warrants attention. Trading appears above the moving average crossovers, but MACD analysis indicates a decline in purchasing power, which may affect the price path in the near future.
Oil Technical Analysis: Technical Outlook
On the hourly time frame, we can see that oil is still trading above the moving average levels, such as the 50 and 100 hourly averages, indicating the presence of support in the market. However, it should be noted that these averages show weakness in the crossovers, which means that the upward momentum may not be sustainable.
MACD reveals a weakness in the upside trend, as the ascending line converges with the descending line, indicating a possible decline in prices. This divergence may mean that purchasing pressures have begun to decline, increasing the possibility of a correction.
Indicators Forecast
- MACD: Indicates weak upward momentum, increasing the chances of a potential correction.
- Relative Strength Index (RSI): Trading near 55 levels, meaning the market is still in a neutral zone, with room for correction or rise.
- Moving Average Indicators: Although prices remain above them, weak crossovers indicate a possible pullback in the near term.
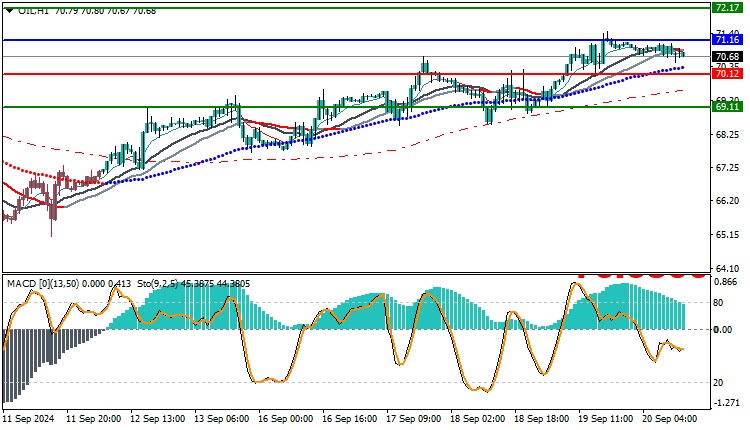
Trading strategies based on Buy/Sell level
| USOIL | In case of buying | in case of selling |
| Entry point | 71.16 | 70.12 |
| Target Point 1 (TP1) | First resistance: 72.17 | First support: 69.11 |
| Target Point 2 (TP2) | Second resistance: 73.20 | Second support: 68.10 |
| Stop Loss (SL) | 70.25 | 71.29 |
Based on the current technical analysis, oil shows weak upward momentum despite trading above the moving averages. If this trend continues, we may see a correction that could push prices towards $69.50 per barrel. The support level at $70.00 should be watched, as it could form a retracement point if any downward pressure occurs.


