
Today, oil is trading at $70.84 per barrel, maintaining its upward trend on the 4-hour time frame. Although the price is trading above the moving average crossovers, which supports the continuation of the upward trend, the MACD indicator indicates a weakness in the upward momentum. In this analysis, we will take a detailed look at the current state of oil price movement and future expectations based on technical indicators.
Oil Technical Analysis: Technical Outlook
On the 4-hour time frame, oil price is moving in an upward trend, supported by the price trading above the moving average crossovers (such as the 50 and 100-period averages). This means that the upward momentum is still relatively strong, but the presence of signs of weakness from the MACD indicator calls for caution.
The MACD indicator shows a convergence between the negative and positive lines, which reflects a decline in the upward strength. This weakness in momentum may indicate that buyers are gradually losing their strength, and we are likely to see a slight correction or slowdown in the upward movement in the coming period.
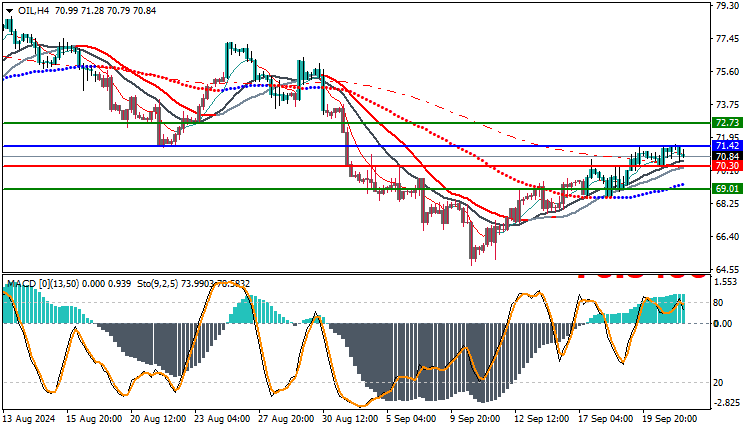
Trading strategies based on Buy/Sell level
| USOIL | In case of buying | in case of selling |
| Entry point | 71.42 | 70.30 |
| Target Point 1 (TP1) | First resistance: 72.73 | First support: 69.01 |
| Target Point 2 (TP2) | Second resistance: 73.80 | Second support: 68.10 |
| Stop Loss (SL) | 70.30 | 71.42 |
Oil continues its upward movement on the 4-hour time frame supported by the price trading above the moving averages. However, the weak signals from the MACD indicator call for caution, as the market may witness a slowdown or a slight correction before resuming the upward momentum. It is advisable to closely monitor the technical indicators to determine whether the market will continue the current trend or witness a change in momentum.


