
Oil is currently trading at $70.05 per barrel, and is under continuous pressure with the price below most of the moving averages. These technical signals reflect a weakness in the buying momentum.
as the MACD indicator reinforces this scenario by indicating a significant decline in purchasing power.
which makes the possibility of a decline a more likely option in the coming period.
Oil Prices Technical Analysis: Technical Outlook
On the time frame, it appears that the price is moving below the main moving averages.
such as the 50 and 200-day moving averages, indicating that the downward trend is dominating the market at the moment. These averages act as major resistance levels that may be difficult for the price to overcome in the short term.
The MACD indicator adds to this pessimism as it shows a clear weakness in purchasing power.
with the MACD line crossing below the signal line and being in the negative area below the zero level. This signal is considered a warning of continued downward pressure, and we may witness an additional decline in oil prices if these negative signals continue.
If the price fails to break the moving averages higher and regain positive momentum, oil may face further declines towards support levels at $69.50 and $68.00 per barrel. If the downward pressure continues, lower levels may be tested.
How does the MACD indicator affect the future?
The MACD indicator provides clear signals of continued weakness in the market. As long as the MACD line continues to trade below the signal line and below the zero level, it indicates that the bearish momentum continues and that the buying power is not enough to reverse the trend. If a positive crossover occurs in the future between the MACD line and the signal line, it may indicate the beginning of a momentum shift, but at the moment, there are no signs of such a shift coming.
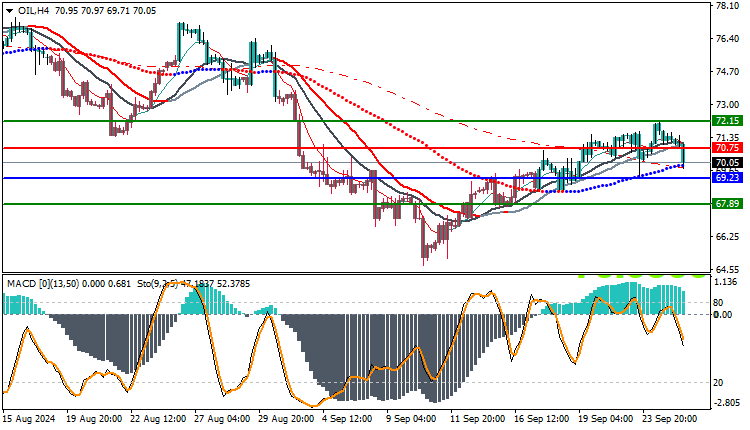
Trading strategies based on Buy/Sell level
| USOIL | In case of buying | in case of selling |
| Entry point | 70.75 | 69.23 |
| Target Point 1 (TP1) | First resistance: 72.15 | First support: 67.89 |
| Target Point 2 (TP2) | Second resistance: 73.00 | Second support: 67.00 |
| Stop Loss (SL) | 69.23 | 70.75 |
Oil prices are facing downward pressures as they trade below most of the moving averages and weak buying power as seen on the MACD. The odds are for further downside in the short term unless there is a shift in momentum or a breakout of the moving averages. Traders should watch for any positive signals on the MACD to determine if there is a potential trend reversal, while remaining cautious of the downside potential.


