
Oil is trading in a narrow price range today. But it is still on its upward trend. Oil opened today at $69.39 per barrel. The highest price it has reached so far was $69.60 per barrel. The lowest price it has reached so far is $68.54 per barrel. Oil is currently trading at $69.17 per barrel. Oil is trading between most of the moving averages crossings. The MACD indicator also indicates some weakness in the upward trend.
Moving Averages Forecast
- Moving Averages:
Oil is currently trading at $69.17 per barrel, and the price is moving between most of the moving averages crossings. This narrow range indicates a balance between buying and selling forces, and may be an indication of a potential move in one direction or another in the near future. If the price breaks the upper limit of the averages range, the upward trend may continue, while breaking the support may lead to a change in the trend.
- MACD Indicator:
The MACD indicator indicates some weakness in the upward trend. Where there is a decline in the strength of the buying momentum, which may mean a decline in the bullish strength in the coming period. Continuation of this weakness may indicate the possibility of testing new support levels before resuming any upward movement.
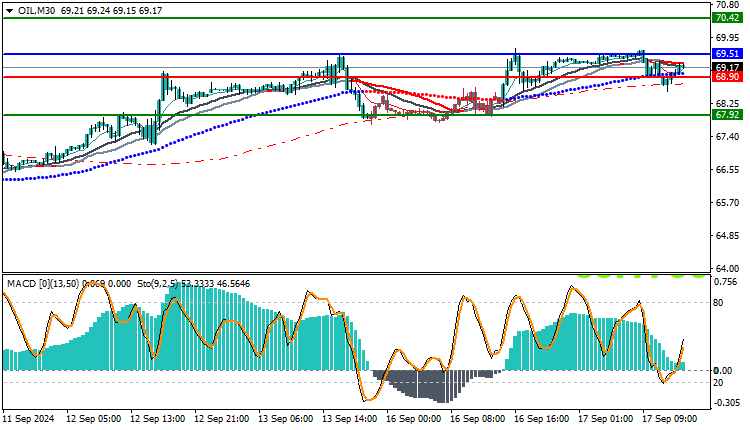
Trading strategies based on Buy/Sell level
| USOIL | In case of buying | in case of selling |
| Entry point | 69.51 | 68.90 |
| Target Point 1 (TP1) | First resistance: 70.42 | First support: 67.92 |
| Target Point 2 (TP2) | Second resistance: 71.80 | Second support: 66.20 |
| Stop Loss (SL) | 68.90 | 69.51 |
Oil remains in a narrow price range as the uptrend continues, but technical indicators such as the MACD are showing some weakness in the momentum. If the price continues to trade between the moving averages, we may see large movements if prices break out of the current range limits. Traders should closely monitor any signs of a trend change or further decline before making trading decisions.


