
Oil price shows a quiet upward trend in an attempt to resume the expected upward trend for today. Oil opened this week at $68.31 per barrel, and recorded its highest price at $69.36 per barrel, while the lowest price it reached so far was $67.76 per barrel. Currently, oil is trading at $69.25 per barrel.
Moving Averages and MACD Indicator
Oil price shows above the moving averages crossings, which reinforces expectations of the continuation of the upward trend. In addition, the MACD indicator indicates the presence of purchasing power, which supports the continuation of this upward trend during the coming period.
Next Resistance Levels?
Given the current price action of oil, the expected next resistance levels are as follows:
- The first level is at $69.80 per barrel, which represents a resistance area close to the current price.
- The second level is at $70.50 per barrel, which is a major resistance level that could form a barrier to the continuation of the rise.
- The third level is at $71.20 per barrel, which is a level that may face selling pressure if the uptrend continues.
Monitoring these levels will be important to determine whether oil will continue to rise or undergo a downward correction.
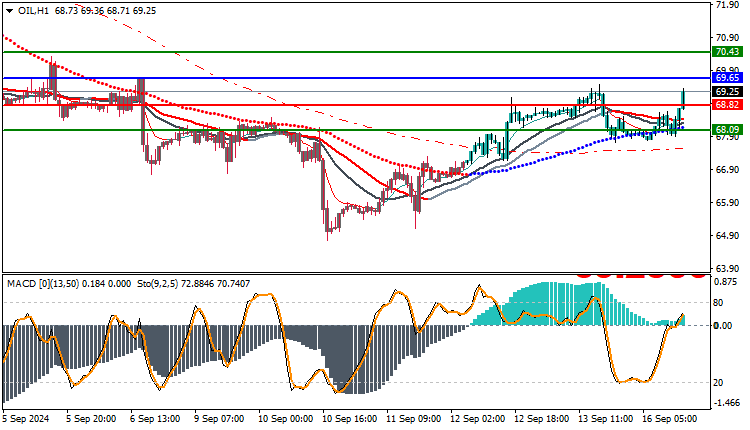
Trading strategies based on Buy/Sell level
| USOIL | In case of buying | in case of selling |
| Entry point | 69.65 | 68.82 |
| Target Point 1 (TP1) | First resistance: 70.43 | First support: 68.09 |
| Target Point 2 (TP2) | Second resistance: 71.10 | Second support: 67.20 |
| Stop Loss (SL) | 68.82 | 72.40 |
With strong buying signals from the MACD indicator and the price rising above the moving averages crossings, the outlook indicates that the uptrend for oil will continue. Traders can carefully monitor the support and resistance levels to analyze any potential changes in the market.


