
NZDUSD Technical analysis today. The New Zealand Dollar (NZD/USD) pair has been trading under strong selling pressure since the beginning of May, due to the strength of the US dollar and the decline in risk appetite in the markets. Prices have broken through more than one technical support area, indicating a weakening uptrend and the beginning of a clear bearish phase. The current technical analysis reflects the continuation of the negative trend unless the technical structure changes under clear conditions.
NZDUSD Technical analysis today: General Technical Outlook:
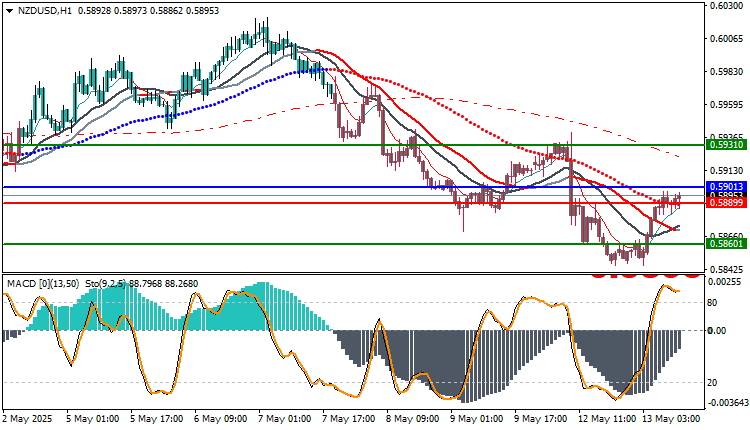
The one-hour chart shows that the pair is trading within an extended descending channel. All recent upward attempts have failed to break through key resistance areas, confirming the dominance of sellers in the overall picture.
Technical Indicator Analysis:
MACD: The histogram shows a sharp negative slope, reflecting the continuation of the downward momentum.
Stochastic Oscillator: It is moving from oversold areas and may produce a temporary correction, but it does not indicate an actual reversal.
Moving Averages: The price is below the 50- and 100-day moving averages, supporting the continuation of the downtrend.
NZDUSD Technical analysis : Expected Scenarios
Bullish Scenario:
If the price is able to break through the 0.5901 level and close above it, we may witness an upward correction attempt towards the 0.5920 area – a strong resistance formed at the recent sub-tops.
The bullish scenario remains limited without a clear break of 0.5931.
Bearish Scenario:
If the price fails to surpass 0.5901 and continues to trade below the moving averages, the decline is likely to resume towards 0.5880 and then 0.5860 as a subsequent technical target.
A break of 0.5860 could open the way towards the 0.5830 level.
Detailed Explanation of Technical Levels
- 0.5901: Important moving resistance – a break above which is a prerequisite for any upward rebound.
- 0.5931: Strong short-term resistance – a previous reversal zone.
- 0.5880 and 0.5860: Nearby technical supports – a break confirms the continuation of the selling trend.
Trading strategies based on Buy/Sell levels
| NZDUSD | In case of buying | in case of selling |
| Entry point | 0.59013 | 0.58899 |
| Target Point 1 (TP1) | First resistance: 0.59310 | First support: 0.58601 |
| Target Point 2 (TP2) | Second resistance: 0.59610 | Second support: 0.58301 |
| Stop Loss (SL) | 0.58899 | 0.59013 |
The technical structure of the NZD/USD pair indicates further declines, amidst the prevailing downtrend and broad US dollar consolidation. Remaining below 0.5900 indicates continued selling pressure, and with continued rejection of resistance levels, a return to 0.5860 and 0.5830 appears likely. We advise caution and anticipation, especially with the upcoming release of the Reserve Bank of New Zealand’s decisions.
Economic Data Impacting the Pair This Week
- Reserve Bank of New Zealand Monetary Policy Statement – May 15
- US Producer Price Index data – May 14
These news releases will be major drivers of market volatility, especially if they surprise compared to expectations.


