
NZDUSD Technical Analysis: The NZD/USD pair is showing a weak downtrend during the current trading session. The pair recorded a high of 0.5643 so far, while the low of 0.5612. At the moment, the pair is trading at 0.5633, reflecting a slight fluctuation around balanced levels. Despite the weak downtrend witnessed by the pair, the moving averages and the MACD indicator analysis indicate that the chances of a turn to an uptrend are present.
NZDUSD Technical Analysis: Technical Analysis
Moving Averages
- Simple Moving Average (SMA): The NZD/USD pair is trading above the short-term moving averages, reflecting the weakness of the current downtrend. The presence of prices above these averages enhances the possibility of resuming the uptrend in the near future.
- Exponential Moving Average (EMA): Prices are trading above the EMAs, indicating that the short-term bullish momentum is continuing, despite the current bearish trend.
MACD Analysis
- The MACD is showing weak negative signals, as the main line is still below the signal line, reflecting a weak bearish trend. However, the distance between the two lines does not indicate strong momentum, which increases the possibility of a limited downtrend continuation or a trend reversal in the near future.
- The weak negative signals from the MACD indicate that the downtrend may be temporary and that the pair may witness an upward reversal soon if trading continues above the moving averages.
Trading Outlook
Based on the technical analysis of the moving averages and the MACD, it appears that the downtrend is very weak and the pair is moving above the strong support levels provided by the moving averages. The downtrend is expected to continue in a limited manner.
with a high probability of the pair turning to an upward movement in the event of a breakout of the resistance level at 0.5643.
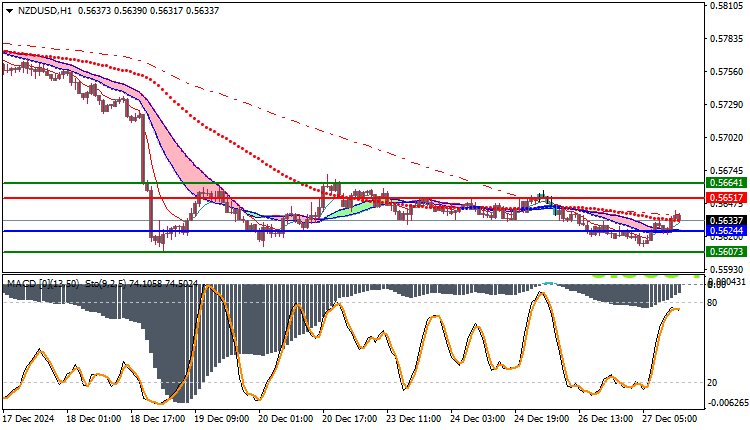
Trading strategies based on Buy/Sell levels
| NZDUSD | In case of buying | in case of selling |
| Entry point | 0.5651 | 0.5624 |
| Target Point 1 (TP1) | First resistance: 0.5664 | First support: 0.5607 |
| Target Point 2 (TP2) | Second resistance: 0.5675 | Second support: 0.5580 |
| Stop Loss (SL) | 0.5624 | 0.5651 |
The pair is showing weakness in the current downtrend, supported by the price trading above the moving averages and weak negative signals from the MACD indicator. If the pair continues to maintain these levels above the moving averages.
the chances of a turn to the upside increase. It is important to monitor the resistance and support levels to accurately determine entry and exit points.


