
NZDUSD Technical Analysis: The NZD/USD pair is showing a long-term bearish trend. However, the pair has recently experienced a period of volatility as it moves within a sideways range.
NZDUSD Technical Analysis: Technical Analysis
- Current price range: The pair’s highest level so far is $0.6154, and its lowest level is $0.6135. The current price is trading at $0.6144, reflecting a noticeable convergence between support and resistance levels.
Moving Average Indicators:
- Oscillation around the averages: Prices are fluctuating between trading above and below the moving averages at the moment. In general, prices remain below the moving averages, indicating a continuation of the long-term downtrend.
MACD Analysis:
- Selling Strength Signals: The MACD indicator is showing a decline in selling strength, which may indicate a possible trend reversal. This decline may serve as a test for momentum to gain momentum for a strong decline in the future.
NZDUSD Technical Analysis: Trading Opportunities
- Selling Opportunities: If the price continues below $0.6154 and there are no strong signs of a reversal, these levels can be viewed as potential resistance.
- Buying Opportunities: If MACD signals a rebound in buying power or a break of $0.6154, there may be a short-term buying opportunity.
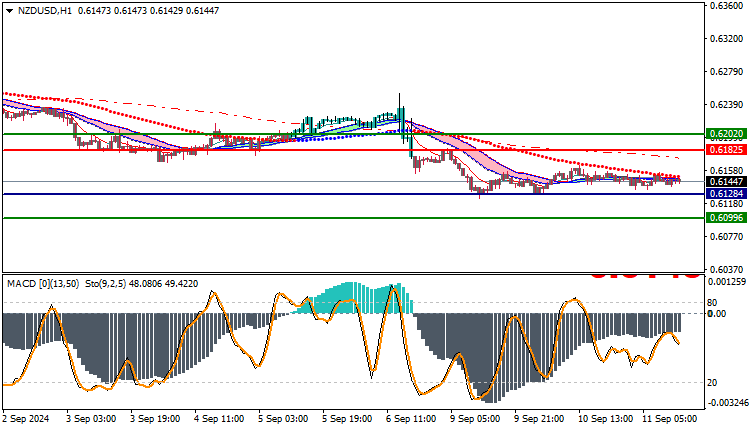
Trading strategies based on Buy/Sell levels
| NZDUSD | In case of buying | in case of selling |
| Entry point | 0.6182 | 0.6128 |
| Target Point 1 (TP1) | First resistance: 0.6202 | First support: 0.6099 |
| Target Point 2 (TP2) | Second resistance: 0.6229 | Second support: 0.6060 |
| Stop Loss (SL) | 0.6128 | 0.6182 |
The NZD/USD pair has been in a range bound state, with the overall downtrend continuing. It is important to follow price action around support and resistance levels, as well as monitor MACD signals to accurately identify trading opportunities.


