
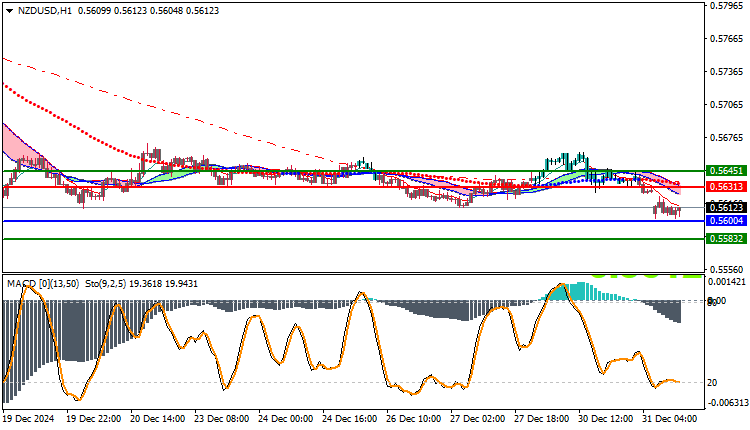
NZDUSD Technical Analysis: The NZD/USD pair continues its downward trend during today’s session, as it recorded its highest price so far at 0.5623 and the lowest price at 0.5602, and is currently trading at the level of 0.5612. The technical analysis shows that the pair is trading below the main moving averages, which reinforces the negative outlook and confirms the continuation of the downward trend in the market.
NZDUSD Technical Analysis: Technical Analysis
The pair is currently trading below the moving averages, which indicates that the general trend in the market is still down. This movement below the moving averages reflects increasing selling pressure, which makes the downward trend likely in the short and medium term. It is advisable to monitor the nearby support levels to determine the points towards which the pair may continue to decline.
MACD Indicator:
The MACD indicator reflects a negative trend, as it appears to be crossing below the zero level. This signal confirms the current bearish momentum in the market, suggesting that selling pressures may continue.
Future Outlook:
If the pair continues to trade below the moving averages, it is likely to continue its decline towards the nearby support levels at 0.5590, with the possibility of testing lower levels if the negative trend continues. In case of any upward correction, the pair may face strong resistance near 0.5630.
Trading strategies based on Buy/Sell levels
| NZDUSD | In case of buying | in case of selling |
| Entry point | 0.5631 | 0.5600 |
| Target Point 1 (TP1) | First resistance: 0.5645 | First support: 0.5583 |
| Target Point 2 (TP2) | Second resistance: 0.5655 | Second support: 0.5560 |
| Stop Loss (SL) | 0.5600 | 0.5631 |
From the current technical analysis, the NZD/USD pair is expected to continue its downtrend during today’s trading session. Selling pressures remain dominant in the market, and the pair is expected to remain below the major moving averages, which enhances the possibility of a decline in prices towards support levels.


