
NZDUSD Technical Analysis: The NZD/USD pair is currently witnessing a bearish trading movement, as it recorded a high of 0.5791 and a low of 0.5752, and is currently trading near the 0.5764 level. The pair appears to be under selling pressure, as the price is trading below the moving averages, which reinforces the continuation of the bearish trend in the market.
NZDUSD Technical Analysis: Technical Analysis
- Moving Averages: The pair is currently trading below the main moving averages, which indicates that the bearish trend is dominating the short and medium term. This trading below the averages reflects the weakness of the bullish momentum and opens the door for a continued decline towards lower support levels.
- MACD Indicator: The MACD indicator is showing clear negative signals, as the indicator is trading at low levels, indicating that the selling momentum is increasing. This indicates the possibility of the bearish trend continuing during the coming period.
Outlook:
Based on technical analysis, the NZD/USD pair is likely to continue its downtrend in the short term. If the price continues to trade below the moving averages and current support levels at 0.5752, we may see further decline towards lower support levels, with a possible test of the 0.5700 area or lower.
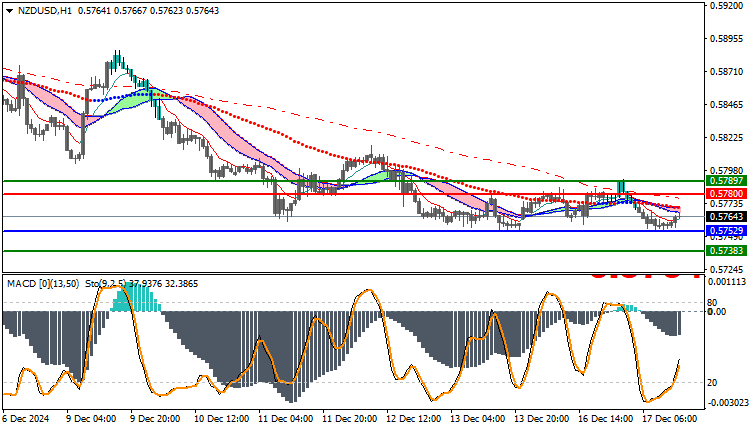
Trading strategies based on Buy/Sell levels
| NZDUSD | In case of buying | in case of selling |
| Entry point | 0.5780 | 0.5752 |
| Target Point 1 (TP1) | First resistance: 0.5789 | First support: 0.5738 |
| Target Point 2 (TP2) | Second resistance: 0.5799 | Second support: 0.5710 |
| Stop Loss (SL) | 0.5752 | 0.5780 |
The overall trend for the NZD/USD pair remains bearish at the moment.
with the price trading below the moving averages and the MACD showing negative signals. Therefore, the selling pressure on the pair is expected to continue, with an eye on testing new support levels in the short term.


