
NZDUSD Technical Analysis: The New Zealand Dollar (NZD/USD) pair is trading in a bearish direction during today’s session, as the pair recorded a high of 0.5872 and a low of 0.5828, while it is currently trading at 0.5835. These movements show that the pair is facing strong selling pressure, reflecting a decline in the buying momentum in favor of the US dollar.
NZDUSD Technical Analysis: Trading Price Analysis
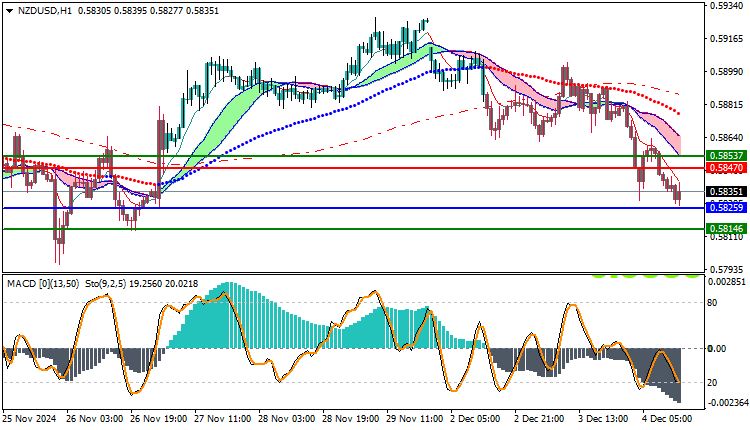
The pair is currently trading below the moving averages, which reinforces expectations of a continuation of the bearish trend in the short term. Trading below these averages shows weakness in the uptrend, and confirms that the general trend remains negative at the moment. With a break of nearby support levels, such as 0.5828, the pair may face further downward pressure in the near term.
Technical Analysis Using Technical Indicators:
- Moving Averages: Trading below the major moving averages indicates that sellers dominate the market, which supports the negative trend. Trading below the moving averages also reflects weakness in previous bullish attempts, and increases the possibility of a continued decline in the short term.
- MACD Indicator: The MACD indicator indicates a negative trend with increasing strength of the decline. The bearish crossover between the MACD line and the signal line is clearly visible, indicating that the selling momentum is increasing, and that there is a great chance of the decline continuing. The distance between the two lines is also widening, which enhances the strength of the current negative trend.
Future Outlook:
The technical outlook indicates that the downtrend for the NZD pair is still in place. If the pair continues to trade below the 0.5840 level, it is likely to head towards the next support levels at 0.5800 or even 0.5770. In the event of any rebound attempts, the pair will find strong resistance at 0.5870 and the moving average levels, which represent major obstacles to any strong rise.
Trading strategies based on Buy/Sell levels
| NZDUSD | In case of buying | in case of selling |
| Entry point | 0.5847 | 0.5825 |
| Target Point 1 (TP1) | First resistance: 0.5853 | First support: 0.5814 |
| Target Point 2 (TP2) | Second resistance: 0.5867 | Second support: 0.5798 |
| Stop Loss (SL) | 0.5825 | 0.5847 |
With the pair trading below the moving averages and the MACD showing negative signals, the overall trend for the NZD/USD pair remains bearish. Selling pressures are expected to continue to dominate the pair in the short term.
with the possibility of further decline towards lower support levels. The development of technical indicators should be monitored to determine the sustainability of this negative trend.


