
NZDUSD Technical Analysis: The NZDUSD pair is trading in a sideways range today, with bullish signals emerging in the market. The pair recorded a high of 0.57394 and a low of 0.56933, and is currently trading at 0.57094. This indicates relative stability within a limited range, but with the potential for an upward movement in the near future.
NZDUSD Technical Analysis: Technical Analysis
The pair is trading above its moving averages, supporting the possibility of resuming the uptrend if trading continues above these levels. The MACD indicator is also showing positive signals, reinforcing the expected upward momentum in the near term. These factors suggest that the market may be in the preliminary stage of a new upward movement if the pair continues to trade above its moving averages.
Trading Outlook:
The NZD/USD pair is expected to continue its sideways movement initially, but with increasing positive signals from the moving averages and MACD, we may see a resumption of the upward movement. If the pair can re-establish a steady rise above 0.57266, it could see further gains towards higher levels. Conversely, any decline below 0.56856 could indicate weakening upward momentum and lead to broader volatility.
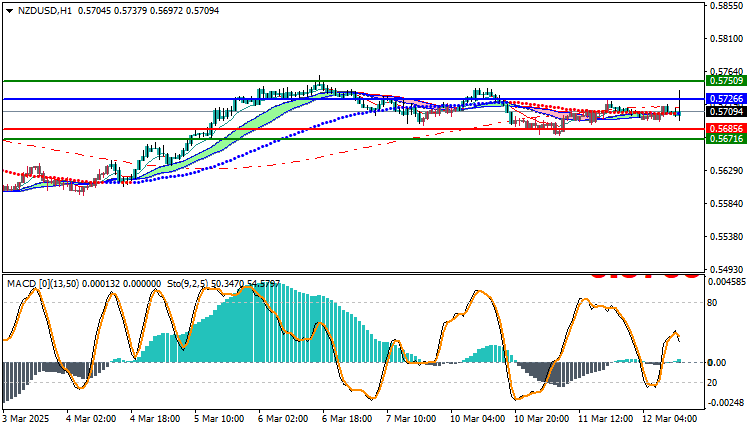
Trading strategies based on Buy/Sell levels
| NZDUSD | In case of buying | in case of selling |
| Entry point | 0.57266 | 0.56856 |
| Target Point 1 (TP1) | First resistance: 0.57509 | First support: 0.56716 |
| Target Point 2 (TP2) | Second resistance: 0.57720 | Second support: 0.56700 |
| Stop Loss (SL) | 0.56856 | 0.57266 |
The overall trend for the NZD/USD pair is showing sideways movements with positive signals supporting a possible upward price trend in the near term. Support from the moving averages and the MACD oscillator reinforces the bullish outlook, putting the pair in a good position for further gains if the positive signals persist. It is important to monitor key support and resistance levels to identify any trend reversals.


