
The NZDUSD pair is trading in a narrow range, amidst a cautious mood in the markets ahead of important economic data releases this week, amid mixed movements for the US dollar following the US Federal Reserve’s monetary policy hints.
NZDUSD Technical Analysis: Pair Overview
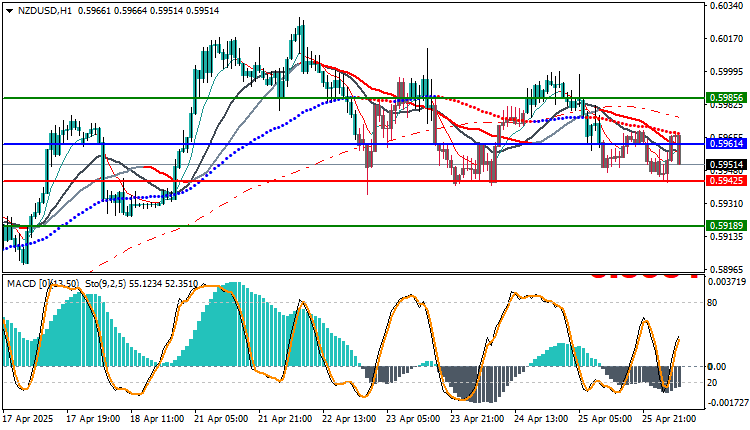
The H1 chart shows that recent movements show the NZD/USD pair holding above vital support levels, with clear fluctuations between 0.5945 and 0.5965, awaiting new catalysts to push prices in either direction.
NZDUSD Technical Analysis: Technical Indicators Analysis
- Moving Averages: The price is moving below some short-term moving averages, reflecting slight selling pressure, but it remains close to moving resistance lines.
- MACD: Indicates weak selling momentum with a potential positive crossover.
- Stochastic: It has begun to rise from oversold areas, supporting the chances of a short-term bullish rebound.
Possible Scenarios for NZDUSD
Bullish Scenario
0.5965: First resistance at a very small swing high.
0.5980: Next resistance based on the ceiling of the oscillation range.
0.5985: A clear resistance level emerging from the last peak before the start of the decline.
0.5995: A psychological resistance area near 0.6000.
0.6005: A breakout of this area could provide additional upward momentum.
0.6015: An upward extension based on a previous technical move.
0.6025: Next resistance and the highest price achieved a week ago.
0.6035: The beginning of important monthly resistances.
Bearish Scenario
0.5945: First minor support is very close.
0.5935: A previous swing low indicates price weakness.
0.5925: Continued selling pressure is pushing towards this level.
0.5918: Strong short-term support (very important).
0.5910: A potential test of an important psychological level below 0.5920.
0.5900: A clear psychological support level (round number).
0.5890: Technical support based on accumulated lows.
0.5880: Continued decline with strong selling pressure that may reach this support.
Trading strategies based on Buy/Sell levels
| In case of buying | in case of selling | NZDUSD |
| 0.59614 | 0.59425 | Entry point |
| First resistance: 0.59856 | First support: 0.59189 | Target Point 1 (TP1) |
| Second resistance: 0.60150 | Second support: 0.58880 | Target Point 2 (TP2) |
| 0.59425 | 0.59614 | Stop Loss (SL) |
The NZDUSD pair is trading within a cautious range, awaiting a clear break to confirm the next trend. Continued stability above 0.5961 could open the way for upward opportunities, while a break of 0.5945 could trigger a broader bearish scenario. It is recommended to monitor US and New Zealand economic data this week, as they will play a key role in determining the pair’s future movement.
Economic Data Expected This Week:
- US GDP Data (QoQ).
- Core Personal Expenditures (PCE) Price Index, the Fed’s preferred inflation indicator.
- New Zealand Retail Sales.
- Comments from US Federal Reserve members.
These data may move markets strongly, particularly for the US dollar and thus affect the NZD/USD pair.


