
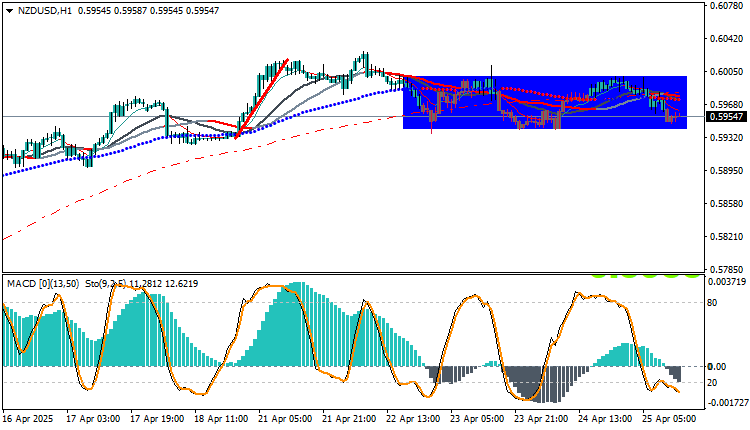
The NZDUSD pair has been trading within a clear consolidation range since April 22nd, after the price failed to maintain its previous gains, reaching peaks around 0.6040. This fluctuation comes amidst the stability of the US dollar on the back of strong economic data, versus the relative weakness of the New Zealand dollar, which is affected by local factors.
NZDUSD Technical Analysis: Overview
The hourly (H1) chart shows the pair confined within a horizontal consolidation range between 0.5935 and 0.6000 (shaded in blue). The overall trend is neutral with a slight downward slope, especially as the price remains below the short- and medium-term moving averages.
NZDUSD Technical Analysis: Analysis of Technical Indicators
Moving Averages
- Moving Averages: The price is moving below the 50-, 100-, and 200-hour moving averages, indicating ongoing selling pressure. • MACD: Shows a negative slope with a negative crossing of the signal line, supporting the possibility of a continued decline.
- Stochastic: Indicates a bearish crossover in areas close to overbought, enhancing the chances of a near-term pullback.
Possible Scenarios
Bullish Scenario
- 0.6010 – 0.6020: Immediate resistance after the breakout, near the highs formed by the price within the blue band.
- 0.6030 – 0.6040: Previous high formed on April 21, a dynamic resistance level.
- 0.6050: Psychological resistance, crossing with the 100-hour moving average approximately.
Bearish Scenario
- 0.5925 – 0.5915: Short-term support levels emerging from previous fluctuations on April 16-17.
- 0.5905 – 0.5895: An important support area that marked the beginning of the upward momentum on April 18.
- 0.5885 – 0.5875: Previous lows formed by the pair in mid-April.
Trading strategies based on Buy/Sell levels
| In case of buying | in case of selling | NZDUSD |
| 0.59950 | 0.59400 | Entry point |
| First resistance: 0.60250 | First support: 0.59100 | Target Point 1 (TP1) |
| Second resistance: 0.60550 | Second support: 0.58800 | Target Point 2 (TP2) |
| 0.59400 | 0.59950 | Stop Loss (SL) |
The NZDUSD is moving in a price equilibrium phase amid anticipation of US data that could be decisive for the upcoming trend. The price remaining below the 0.6000 level maintains selling pressure, while any break above this area could open the way for a corrective upside. We recommend closely monitoring the 0.5935 level as a pivotal support that should be carefully monitored.
Important economic data this week (affecting the pair):
- Thursday, April 26: Core PCE – the US Federal Reserve’s preferred measure of inflation.
- From New Zealand: There are no significant data releases this week, making the pair’s movements more sensitive to changes coming from the US side.


