
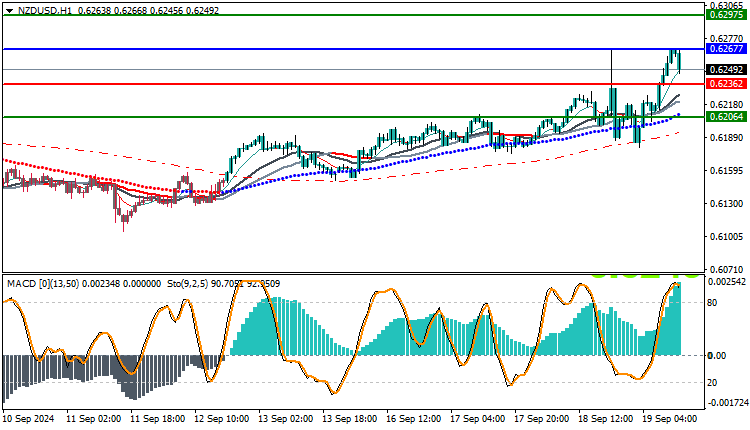
The NZDUSD pair is trading today at $0.6249, where the pair is currently witnessing significant buying momentum supported by its trading above the moving average crossovers. Despite the continued buying power supported by the MACD indicator, the pair is facing a strong resistance area at the 0.6267 level, which makes it in an important testing phase that may determine the next direction.
NZD/USD Technical Analysis: Technical Outlook
The technical chart of the NZDUSD pair shows that the pair is trading steadily above the moving average crossovers, especially the 50 and 100-day averages, which reflects strong buying momentum. The 0.6267 level is a key resistance area to watch closely, as a break of this level may pave the way for further gains.
The MACD indicator indicates continued buying power with the rising line holding above the falling line, indicating the possibility of continuing the uptrend. However, the market reaction at the resistance level of 0.6267 should be monitored, as the pair may face some difficulties in breaking this level if the momentum is not sufficiently strengthened.
Indicators Forecast
- MACD: indicates continued buying power, which increases the possibility of breaking the resistance at 0.6267.
- RSI: shows trading near neutral levels, giving the pair room to move before reaching overbought areas.
- Moving Averages: indicate strong upward support, as the pair is trading steadily above the moving averages.
Trading strategies based on Buy/Sell levels
| NZDUSD | In case of buying | in case of selling |
| Entry point | 0.6267 | 0.6236 |
| Target Point 1 (TP1) | First resistance: 0.6297 | First support: 0.6206 |
| Target Point 2 (TP2) | Second resistance: 0.6327 | Second support: 0.6176 |
| Stop Loss (SL) | 0.6236 | 0.6267 |
Based on the current technical analysis, the NZDUSD pair appears to be continuing its upward trajectory supported by its trading above the moving averages and the strong buying momentum indicated by the MACD indicator. However, the resistance area at 0.6267 will remain a major obstacle to the continuation of the uptrend. In case of a breakout of this level, we may see further rise towards new levels, while the main support remains near 0.6220 in case of any corrective pullbacks.


