
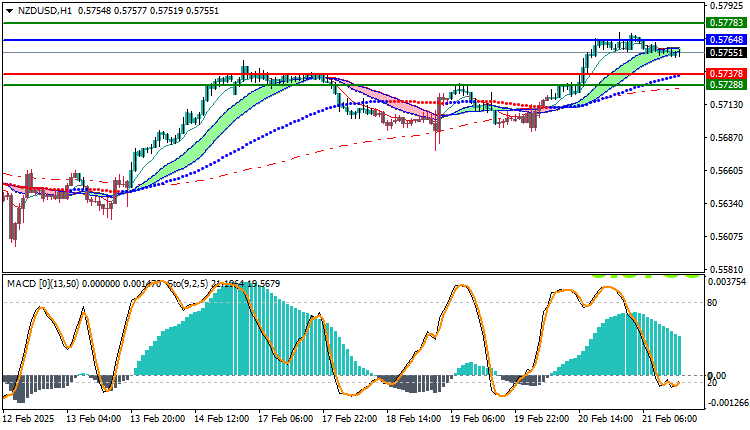
NZDUSD Technical Analysis: The NZD/USD pair is trading in an uptrend today with some sideways fluctuations, as the pair recorded its highest price so far at 0.57700 and the lowest price at 0.57506. At the moment, the pair is trading at the level of 0.57551, reflecting a sideways movement between certain levels while the overall bullish momentum remains.
NZDUSD Technical Analysis: Trading Price Analysis
It is noted that the pair is trading above the moving averages indicators, which reinforces the bullish trend at the moment. However, although the prices indicate bullish momentum, the sideways movement may be a sign of some hesitation or weakness in the positive momentum at the moment.
Technical Analysis:
Technically, the MACD indicator shows a positive trend, reflecting the continuation of the bullish momentum. However, the weak MACD signal suggests that the uptrend may face some challenges or slowdown in the short term. This could mean that the positive momentum is not strong enough to push the pair to higher levels on a sustained basis at the moment.
Forward Outlook:
If the pair continues to trade above the current support levels, the uptrend may continue, but if the momentum continues to weaken (as indicated by the MACD), prices may witness a sideways movement or temporary correction before resuming the uptrend.
Trading strategies based on Buy/Sell levels
| NZDUSD | In case of buying | in case of selling |
| Entry point | 0.57648 | 0.57378 |
| Target Point 1 (TP1) | First resistance: 0.57783 | First support: 0.57288 |
| Target Point 2 (TP2) | Second resistance: 0.57921 | Second support: 0.57174 |
| Stop Loss (SL) | 0.57378 | 0.57648 |
The NZD/USD pair is showing a bullish trend with sideways trading, trading above the moving averages which reinforces the upside. However, the MACD indicator is pointing to a positive trend with some weakness, highlighting the need to monitor the market to see if the positive momentum will continue or face pressures that may lead to a correction or a continued sideways movement.


