
NZDUSD Technical Analysis: The NZDUSD pair continues to move in an upward trend today (January 24, 2025), as the pair recorded its highest trading price so far at 0.57208 and its lowest price at 0.56689. The pair is currently trading at 0.57004, reflecting the continuation of the upward trend.
NZDUSD Technical Analysis: Technical Analysis
Current price action indicates that the pair is trading above the moving averages levels on various time frames.
which reinforces the presence of a strong bullish trend at the present time. Trading above these averages is an indication of the stability of the bullish trend and the availability of strong support at current levels.
On the other hand, the MACD indicator is showing positive signs, as it reflects a bullish crossover with the signal line, indicating that the buying momentum is still strong and supports the continuation of the upward movement.
Future Analysis:
If the pair continues to trade above the moving averages, it is expected to witness further rise towards higher resistance levels. The pair may test the 0.57208 level again, and if it breaks it, it may head towards new bullish levels.
However, in case of any price pullback and break of the pivotal support levels or a decline in the MACD indicator.
this may indicate a possible downside correction in the short term.
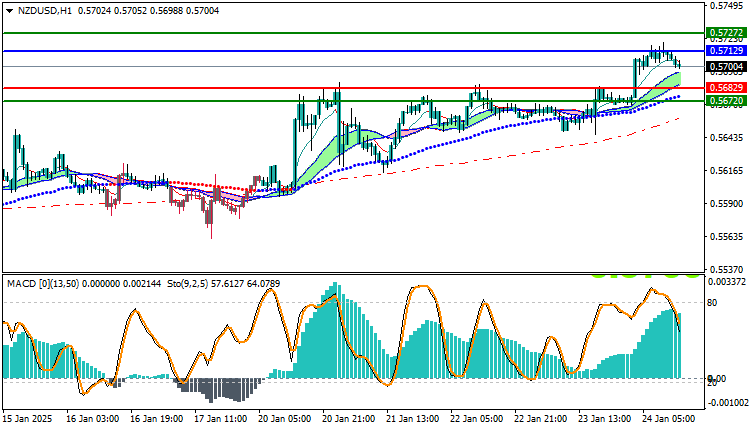
Trading strategies based on Buy/Sell levels
| NZDUSD | In case of buying | in case of selling |
| Entry point | 0.57129 | 0.56829 |
| Target Point 1 (TP1) | First resistance: 0.57272 | First support: 0.56345 |
| Target Point 2 (TP2) | Second resistance: 0.57421 | Second support: 0.56220 |
| Stop Loss (SL) | 0.56829 | 0.57129 |
The technical analysis of the NZD/USD pair shows the continuation of the uptrend supported by the price trading above the moving averages and positive signals from the MACD indicator. It is important to follow the price movements around the support and resistance levels to monitor any changes that may affect the trend in the future.


