
NZDUSD Technical Analysis: The NZD/USD pair is trading in an upward trend today, as the pair recorded a daily high of 0.56235 and a low of 0.55938, while it is currently trading at 0.56024. This positive move reflects the presence of bullish momentum in the market, and indicates the continuation of the bullish trend in the short term.
NZDUSD Technical Analysis: Technical Analysis
- Moving Averages: The pair shows stable trading above the major moving averages, such as the 50- and 200-day simple moving averages, which reinforces the positive signal and confirms the continuation of the bullish trend. This means that the market remains poised to continue in the positive trend as long as trading continues above these averages.
- MACD Indicator: The MACD indicator indicates a positive trend, as it shows a bullish crossover between the MACD line and the signal line, which reflects the presence of strong bullish momentum in the market. This signal confirms the possibility of continuing the upward movement, with the possibility of achieving more gains if the current situation persists.
Future expectations:
If the pair continues to maintain its current levels above the support level at 0.5590, it is expected to continue the upward trend.
with the next resistance levels being tested at 0.5630 and 0.5650. In the event of a decline and a break below the support levels.
the pair may witness a corrective movement towards lower levels.
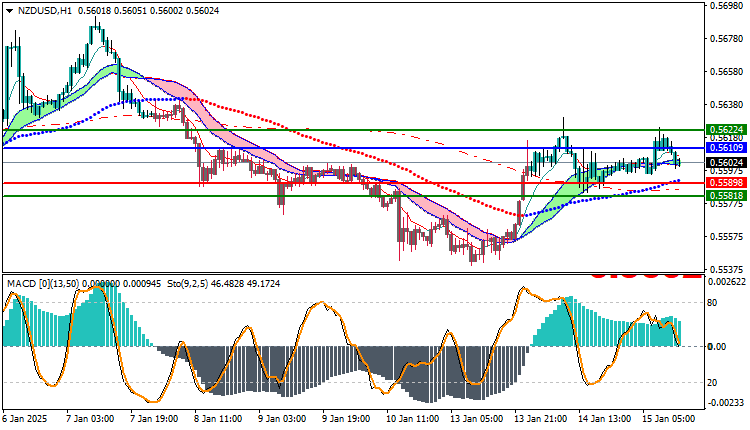
Trading strategies based on Buy/Sell levels
| NZDUSD | In case of buying | in case of selling |
| Entry point | 0.56109 | 0.55898 |
| Target Point 1 (TP1) | First resistance: 0.56224 | First support: 0.55818 |
| Target Point 2 (TP2) | Second resistance: 0.56421 | Second support: 0.55711 |
| Stop Loss (SL) | 0.55898 | 0.56109 |
The current technical analysis shows that the NZD/USD pair is in an uptrend.
supported by the positive momentum generated by the pair trading above the moving averages and the MACD indicator. If trading continues above the key support levels, the uptrend is likely to continue towards the upcoming resistance levels. Traders should follow these levels to identify suitable entry and exit opportunities.


