
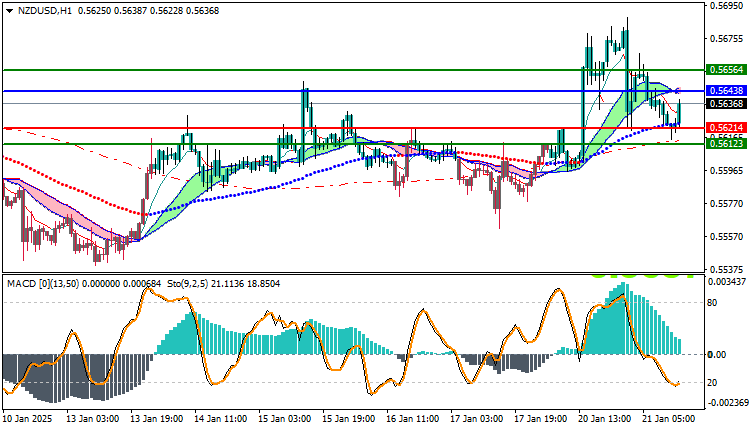
NZDUSD Technical Analysis: The NZD/USD pair is currently showing bullish trading activity, with the pair recording a daily high of 0.56398 and a low of 0.56140, and is currently trading at 0.56368. Trading at this level indicates the continuation of the bullish trend, although this trend faces some constraints in terms of momentum.
NZDUSD Technical Analysis: Price Analysis
The pair is trading above most of the moving averages indicating support for the short-term bullish trend, as this movement reflects the preference of buyers for the pair. Despite the bullish trend, the weakness in momentum may limit the continuation of this trend, which may create challenges in case of encountering strong resistance levels.
Technical Analysis
Moving Averages and MACD:
- Moving Averages: Price action above most of the moving averages indicates clear support for the bullish trend. This indicates that the buying power is still there, but the weak momentum may lead to limited price volatility or difficulty in making new highs.
- MACD Indicator: The MACD indicator indicates a positive trend, but it also shows the weakness of the current momentum. This signal means that there is some optimism in the market, but the strength in the momentum is not enough to support a strong continuation of the uptrend.
Future Market Outlook:
The pair is expected to remain in a limited upward movement if trading above the moving averages continues. However, the pair may struggle to push prices to much higher levels if the weak momentum continues, and the market may witness a correction or volatility in the short term.
Trading strategies based on Buy/Sell levels
| NZDUSD | In case of buying | in case of selling |
| Entry point | 0.56438 | 0.56214 |
| Target Point 1 (TP1) | First resistance: 0.56564 | First support: 0.56123 |
| Target Point 2 (TP2) | Second resistance: 0.56720 | Second support: 0.56000 |
| Stop Loss (SL) | 0.56214 | 0.56438 |
The NZD/USD pair appears to be in an uptrend, supported by trading above the moving averages. However, the weakness in momentum as shown by the MACD indicator suggests that this trend may face some limitations in continuation. It is important to follow the market closely, as weak momentum may lead to volatility or a short-term correction.


