
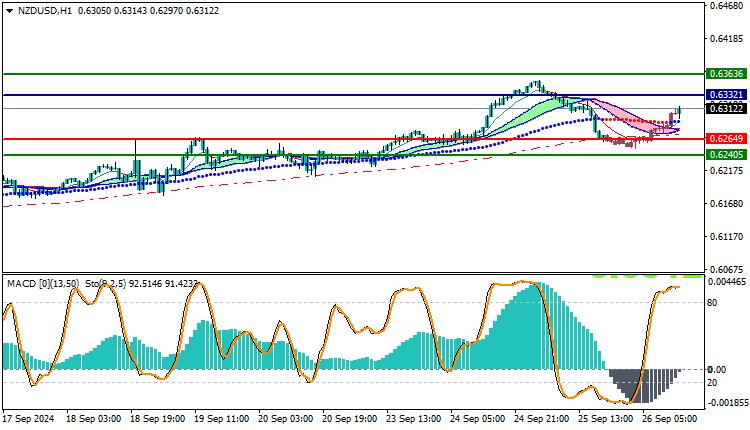
NZDUSD Technical Analysis: The NZDUSD pair is trading in a bearish trend today, but it shows a clear weakness in this trend. The pair recorded its lowest price today at 0.6250, rose to its highest price at 0.6313, and is currently trading at 0.6312.
NZDUSD Technical Analysis Technical Analysis:
Technical indicators indicate that the pair is trading above the moving averages, indicating a weakness in the downtrend. The MACD indicator is also showing signs of the end of the negative trend, which enhances the chances of a positive reversal.
NZDUSD Technical Analysis Expectations during the day:
- In the event of an uptrend: If the pair continues to stabilize above the 0.6310 level, we may see upward movements targeting the resistance levels at 0.6350 and 0.6380.
- In case of a decline: If the pair breaks the 0.6250 level, with confirmation from the MACD indicator, we may witness a decline targeting the support levels at 0.6220 and 0.6200.
Trading strategies based on Buy/Sell levels
| NZDUSD | In case of buying | in case of selling |
| Entry point | 0.6312 | 0.6264 |
| Target Point 1 (TP1) | First resistance: 0.6363 | First support: 0.6240 |
| Target Point 2 (TP2) | Second resistance: 0.6384 | Second support: 0.6220 |
| Stop Loss (SL) | 0.6264 | 0.6312 |
Despite the downward trend, technical indicators indicate that there are opportunities for an upward correction. It is advisable to carefully monitor the technical levels to determine the optimal entry and exit points in the market.


