
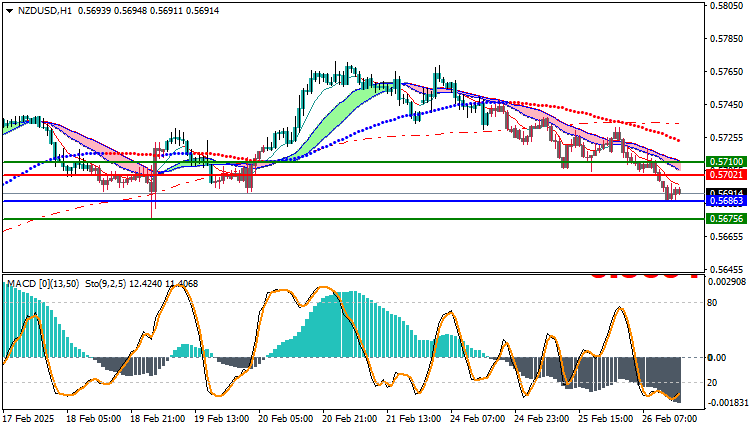
NZDUSD Technical Analysis: The New Zealand Dollar pair is trading in a bearish trend today, as the pair recorded its highest price so far at 0.57315 and its lowest price at 0.56863, while it is currently trading at 0.56914. This fluctuation indicates the presence of selling pressure on the pair, which reinforces the current bearish trend.
NZDUSD Technical Analysis: Technical Analysis
Technically, we notice that prices are trading below the moving averages, which reflects the continuation of bearish pressure in the short term. In addition, the MACD indicator indicates a negative trend, as bearish crossover signals appear between the moving averages of the indicator, which contributes to confirming the weakness of the buying momentum and enhances the possibility of the continuation of the bearish trend in the coming period.
Trading Outlook:
If the pair continues to trade below the moving averages, the downtrend is likely to continue, with the possibility of testing the nearby support levels at 0.56863 and 0.56756. Any bullish bounce would require a break of the resistance level at 0.57021 to reflect an improvement in buying momentum, but for now, selling pressures remain dominant.
Trading strategies based on Buy/Sell levels
| NZDUSD | In case of buying | in case of selling |
| Entry point | 0.57021 | 0.56863 |
| Target Point 1 (TP1) | First resistance: 0.57100 | First support: 0.56756 |
| Target Point 2 (TP2) | Second resistance: 0.57200 | Second support: 0.56521 |
| Stop Loss (SL) | 0.56863 | 0.57021 |
The general trend of the NZD/USD pair remains bearish. Traders are advised to follow support and resistance levels to identify suitable trading opportunities in the coming periods, taking into account the continuation of the negative trend unless signs of a change in momentum appear.


