
NZDUSD Technical Analysis: The NZDUSD pair is trading in a weak bearish trend today, as the pair recorded a high of 0.56509, while the low of 0.56291. Currently, the pair is trading at 0.56486.
NZDUSD Technical Analysis: Technical Analysis
By following the price action, it appears that prices are trading below the moving averages indicators, which supports the downward trend and enhances the possibility of this trend continuing in the short term. The MACD indicator reflects a negative trend with a weak momentum, indicating that there is ongoing selling pressure, but not strong enough to push the pair sharply down at the moment.
Future Outlook:
Under the current conditions, the pair is expected to continue to fluctuate within a weak bearish range, with the possibility of facing further declines if the selling pressure continues, especially if trading continues below the moving averages. On the other hand, if the pair is able to overcome some resistance levels, there may be some improvement in the technical momentum, which opens the way for a slight upward fluctuation.
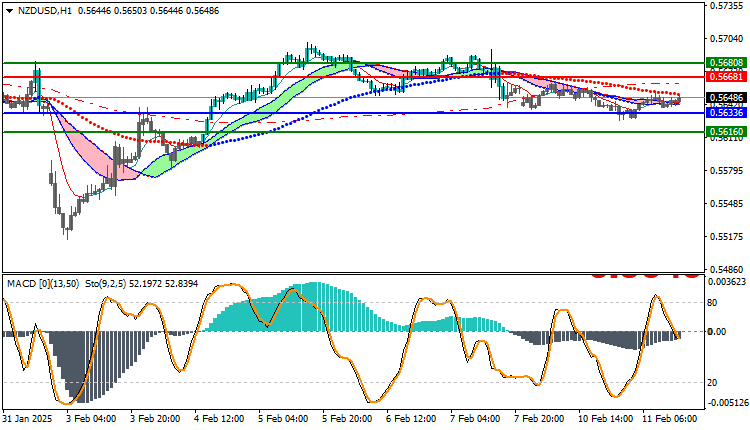
Trading strategies based on Buy/Sell levels
| NZDUSD | In case of buying | in case of selling |
| Entry point | 0.56681 | 0.56336 |
| Target Point 1 (TP1) | First resistance: 0.56808 | First support: 0.56160 |
| Target Point 2 (TP2) | Second resistance: 0.56901 | Second support: 0.55910 |
| Stop Loss (SL) | 0.56336 | 0.55910 |
Based on current technical indicators, the weak downtrend is still in effect at the moment, with signs of weakening negative momentum. Traders should closely monitor support and resistance levels to determine whether the downtrend will continue or if any reversals will occur to support the upward movement.


