
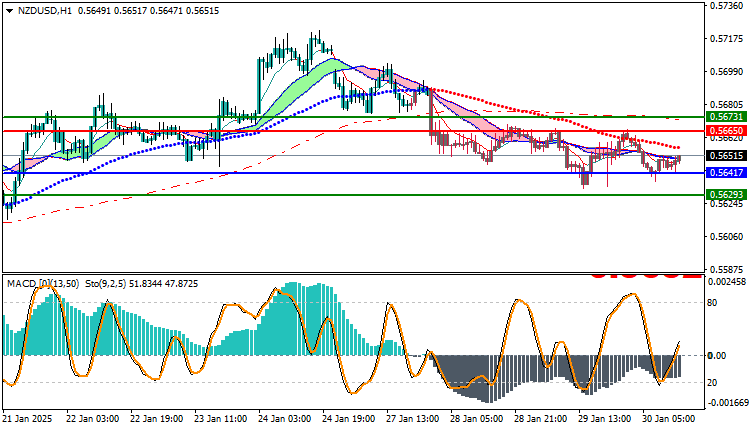
NZDUSD Technical Analysis: The NZDUSD pair is trading in a bearish trend today, as the pair recorded its highest price so far at 0.56661 and the lowest price at 0.56374, while it is currently trading at 0.56515.
NZDUSD Technical Analysis: Technical Analysis
The pair shows continuous trading below the moving averages indicators on different time periods, which enhances the continuation of the downtrend. The moving averages are dynamic resistance areas, indicating that prices are still under selling pressure.
In addition, the MACD indicator is showing negative signals, as it is trading in the negative zone with the lines crossing downwards. This signal is a strong indicator that the downtrend may continue, which weakens the possibility of any upward movement in the near term.
Trading Expectations:
Based on the current situation, the pair is expected to continue moving in a bearish trend, with the possibility of testing the nearby support levels at 0.56300. If the pair manages to break these levels, the decline may extend towards deeper support levels. However, in case of an upward rebound, the pair may face strong resistance at the 0.56600 level.
Trading strategies based on Buy/Sell levels
| NZDUSD | In case of buying | in case of selling |
| Entry point | 0.56650 | 0.56417 |
| Target Point 1 (TP1) | First resistance: 0.56731 | First support: 0.56293 |
| Target Point 2 (TP2) | Second resistance: 0.56821 | Second support: 0.56022 |
| Stop Loss (SL) | 0.56417 | 0.56650 |
The overall trend for the NZD/USD pair remains bearish, with negative signals from the moving averages and MACD. The downtrend is expected to continue in the short term, with support and resistance levels being closely monitored to identify entry or exit opportunities.


