
NZDUSD Technical Analysis: The New Zealand Dollar against the US Dollar (NZD/USD) pair witnessed bearish movements today, recording a high of 0.5572 and a low of 0.5539. At the moment, the pair is trading near the 0.5545 level, indicating that selling pressure on the pair continues.
NZDUSD Technical Analysis: Technical Analysis
Moving Averages:
The pair shows prices trading below the main moving averages, indicating the dominance of the bearish trend in the short term. This decline in prices below the moving averages is evidence of weak bullish momentum, and increases the likelihood of the downtrend continuing as long as there is no strong breakout of the resistance levels.
MACD Analysis:
The MACD indicator indicates a negative condition as the MACD line is trading below the Signal Line. This negative signal enhances the likelihood of the bearish trend continuing in the short term. The lack of bullish crossovers on the indicator may indicate that there is not enough strength to return to higher levels at the moment.
Forward Outlook:
Based on the current technical analysis, the NZD/USD pair is expected to continue its downtrend in the short-term, with a possible test of the nearby support levels at 0.5530. If the pair fails to break the 0.5570 level, it may decline again towards lower levels.
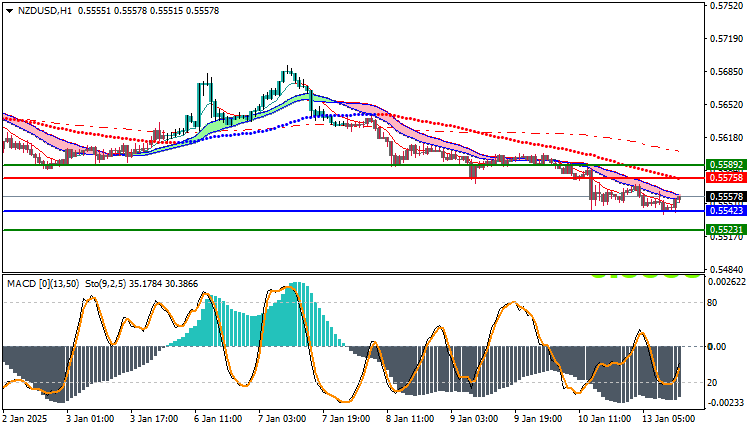
Trading strategies based on Buy/Sell levels
| NZDUSD | In case of buying | in case of selling |
| Entry point | 0.5575 | 0.5542 |
| Target Point 1 (TP1) | First resistance: 0.5589 | First support: 0.5523 |
| Target Point 2 (TP2) | Second resistance: 0.5599 | Second support: 0.5503 |
| Stop Loss (SL) | 0.5542 | 0.5575 |
Technical analysis of the NZD/USD pair shows that the overall trend is bearish at the moment, supported by the price trading below the moving averages and negative signals from the MACD indicator. The selling pressure on the pair is expected to continue in the short term, with key support levels being monitored as potential targets for a pullback.


