
NZDUSD Technical Analysis: The NZD/USD pair is trading in a bearish trend today, as the pair recorded its highest price in the current session at 0.5639 and the lowest price at 0.5587. At the moment, the pair is trading at the level of 0.5591, which reflects the continued selling pressure in the market. The technical analysis indicates that the general trend of the NZD/USD pair is still bearish, and it is supported by various technical factors.
NZDUSD Technical Analysis: Trading Price Analysis
The pair witnessed movements within a narrow range today.
as prices traded between the level of 0.5639 as a high price and the level of 0.5587 as a low price. Currently, the pair is trading at 0.5591, which indicates the continued selling pressure in the market. This is clearly evident in the price action.
which continues to fluctuate without any strong signals from buyers to raise prices above the current resistance levels.
Technical Analysis:
- Moving Averages: Prices are trading below the moving averages, which clearly indicates a bearish trend. When the price trades below the moving averages, it reflects the dominance of sellers in the market. This signal is considered traditional in determining the general trend, as the pair appears below the short and long moving averages, which reinforces expectations of a continuation of the downward trend.
- MACD Indicator: The MACD indicator is currently showing negative signals, as the MACD line is trading below the signal line. This signal indicates weak buying momentum and increasing selling pressure, which reinforces the possibility of a continuation of the downward trend in the near term.
Trading Expectations:
Based on current data, the pair is expected to continue its downward trend in the short term. If the price continues to decline, the next support levels may be near 0.5580. If this support is broken, we may see further declines towards lower levels. However, in the event of an upward rebound, the pair needs to break the 0.5630 resistance to change the current trend.
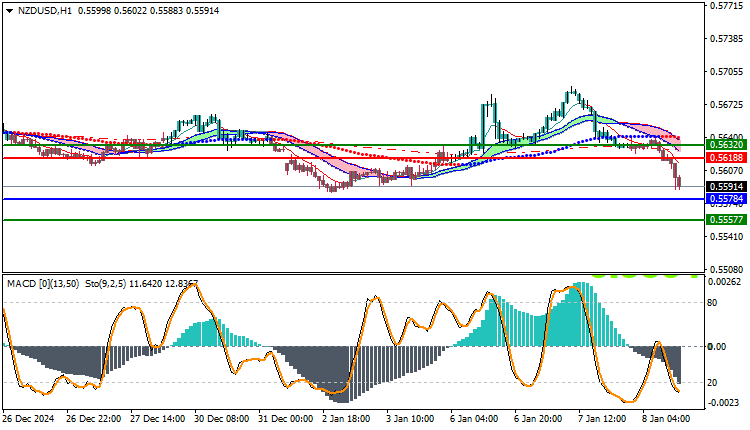
Trading strategies based on Buy/Sell levels
| NZDUSD | In case of buying | in case of selling |
| Entry point | 0.5618 | 0.5578 |
| Target Point 1 (TP1) | First resistance: 0.5632 | First support: 0.5557 |
| Target Point 2 (TP2) | Second resistance: 0.5644 | Second support: 0.5532 |
| Stop Loss (SL) | 0.5578 | 0.5618 |
Based on the current technical analysis, where prices are trading below the moving averages and the MACD is pointing in a negative direction, the downtrend in the NZD/USD pair is likely to continue. It is important to monitor the key support and resistance levels at 0.5580 and 0.5630 to identify any potential changes in the trend.


