
NZDUSD Technical Analysis: The NZD/USD pair is trading in a bearish trend today, as the pair recorded its highest price so far at 0.5777 and the lowest price at 0.5754, and is currently trading at 0.5775. Although the general trend is bearish, the current movement shows some weakness in the negative momentum.
NZDUSD Technical Analysis: General Market Trend
The pair is trading below the level of most moving average indicators, which supports the continuation of the bearish trend in the short term. However, the current movement shows some stability near these averages, which reflects the lack of negative momentum and may open the way for upward correction opportunities in case the downward pressures weaken.
Technical Indicators Analysis:
- Moving Averages:
Trading the pair below the main moving averages indicates the bearish trend dominating the market. However, price movements above or near these averages may be a sign of a possible bullish bounce soon if the negative momentum weakens.
- MACD Indicator:
MACD Indicator reflects a negative trend, but there are signs of weakness in the bearish momentum. This decrease in the strength of the decline may indicate that the downtrend may weaken in the near future, and an upward correction or trend reversal may appear if this weakness continues.
Advanced Technical Analysis:
Current price movement below the moving averages supports the downtrend, but the decrease in the strength of the negative momentum as shown by the MACD indicator may indicate potential opportunities for a pause in the decline or a limited bullish bounce. Therefore, the development of price movement should be monitored at support and resistance levels close to current prices.
Future Outlook:
If the pair continues to trade below the moving averages with weak negative momentum in the MACD indicator, the downtrend is expected to continue in the short term. However, increasing weakness in the downtrend may enhance the chances of an upward bounce in the near future.
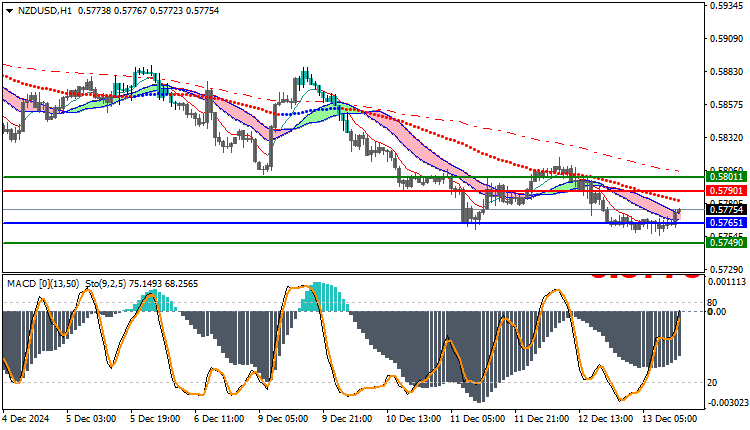
Trading strategies based on Buy/Sell levels
| NZDUSD | In case of buying | in case of selling |
| Entry point | 0.5790 | 0.5765 |
| Target Point 1 (TP1) | First resistance: 0.5801 | First support: 0.5749 |
| Target Point 2 (TP2) | Second resistance: 0.5812 | Second support: 0.5728 |
| Stop Loss (SL) | 0.5765 | 0.5790 |
The NZD/USD pair is trading in a downtrend, with weak negative momentum as shown by the MACD indicator. Price action should be watched near moving averages and key support and resistance levels, as these points may be key to a potential trend reversal or upward correction.


