
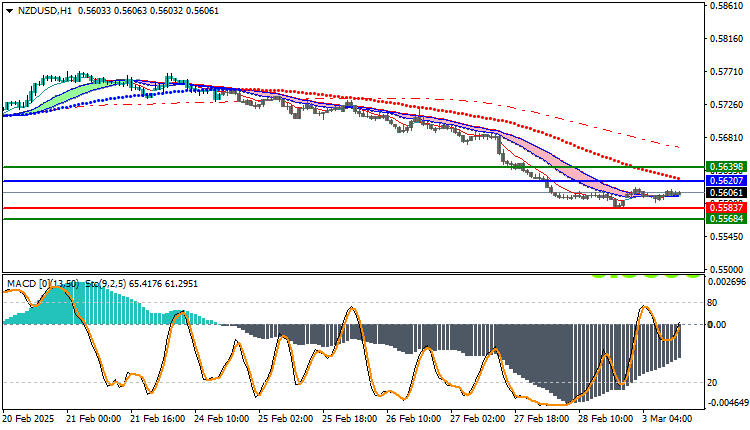
NZDUSD Technical Analysis: The NZDUSD pair is trading in a bearish trend today, as the pair recorded its highest price so far at 0.56130, and the lowest price at 0.55901. At the moment, the pair is trading at the level of 0.56061, which reflects limited fluctuation within a narrow range. Prices are also trading below the moving average indicators
NZDUSD Technical Analysis: Technical Analysis
- Technical Analysis Indicators: The MACD indicator is showing a negative trend, which reflects the weakness of the bullish momentum and indicates that there is a possibility of the downward trend continuing. The negative signal from the MACD indicator supports expectations that selling pressures may control the market at the present time.
Trading Expectations:
The NZDUSD pair is expected to continue moving within the bearish trend in the coming hours, especially in light of its trading below the moving averages and the negative MACD indicator signal. If the selling pressure continues, we could see a test of the support level at 0.55837, with a potential for a larger pullback if this support is breached. On the other hand, if the pair manages to break the resistance level at 0.56207, we could see a bounce towards higher levels.
Trading strategies based on Buy/Sell levels
| NZDUSD | In case of buying | in case of selling |
| Entry point | 0.56207 | 0.55837 |
| Target Point 1 (TP1) | First resistance: 0.56398 | First support: 0.55684 |
| Target Point 2 (TP2) | Second resistance: 0.56541 | Second support: 0.55547 |
| Stop Loss (SL) | 0.55837 | 0.56207 |
The NZD/USD pair remains in a bearish trend with clear selling pressure, which is supported by trading below the moving averages and the negative signal from the MACD indicator. It is preferable to closely monitor the support and resistance levels to determine the next direction in the market, especially if the selling pressure continues or a rebound towards higher levels occurs in case of a resistance breakout.


