
NZDUSD Technical Analysis: The New Zealand Dollar pair is trading today at the beginning of a bearish trend, as the pair recorded its highest trading price so far at 0.56713 and the lowest price at 0.56314, while it is currently trading at 0.56395. These movements indicate the beginning of the emergence of bearish pressure in the market, with a relative decline in the price indicating the possibility of the bearish trend continuing in the coming period.
NZDUSD Technical Analysis: Technical Analysis
Technically, the pair appears to be trading below the moving averages, which reinforces the bearish trend and is considered a negative signal in the short term. Trading below the moving averages indicates weak buying momentum and supports the continuation of the bearish pressure. If this situation continues, the bearish trend may extend for a longer period.
Future Market Outlook:
The pair is expected to continue moving in a bearish trend in the short term, especially if it continues to trade below the moving averages and the MACD indicator is in a negative direction. Nearby support levels should be monitored to determine if the pair will encounter a strong support level that may limit the decline or if it will continue to decline further.
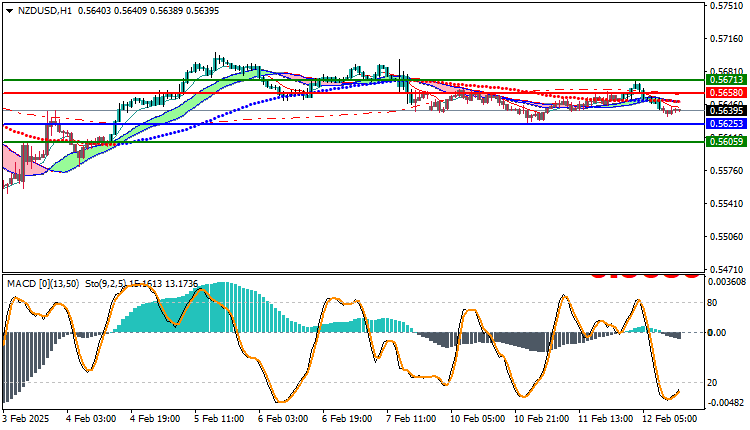
Trading strategies based on Buy/Sell levels
| NZDUSD | In case of buying | in case of selling |
| Entry point | 0.56580 | 0.56253 |
| Target Point 1 (TP1) | First resistance: 0.56713 | First support: 0.56059 |
| Target Point 2 (TP2) | Second resistance: 0.56814 | Second support: 0.56210 |
| Stop Loss (SL) | 0.56253 | 0.56580 |
The NZD/USD pair is showing the beginning of a downtrend, supported by trading below the moving averages and a negative signal from the MACD indicator. If the negative momentum continues, the downtrend is likely to persist in the short term. Traders should monitor support levels to identify potential selling opportunities or any changes in the market trend.


