
NZDUSD Technical Analysis: The New Zealand Dollar (NZD/USD) pair is trading in a bearish trend during today’s trading, as the pair recorded a high of 0.5648 and a low of 0.5610, and is currently trading at 0.5638. This movement indicates the continuation of the bearish trend.
NZDUSD Technical Analysis: Technical Analysis
At the technical analysis level, we notice that prices are trading below the moving average indicators, which reinforces the idea of the continuation of the bearish trend at the present time. The MACD indicator is also showing negative signals, indicating the presence of continuous selling pressure on the pair. However, the MACD crossovers indicate a weakness in the strength of the bearish trend, which reflects some hesitation in continuing the negative movement strongly.
Future Trading Outlook:
Under these circumstances, the pair may witness some fluctuation in the coming period, as it is likely to range between nearby support and resistance levels. Continued trading below the moving averages may support the bearish trend in the short term, while any further weakness in the selling momentum may open the way for some temporary upward corrections.
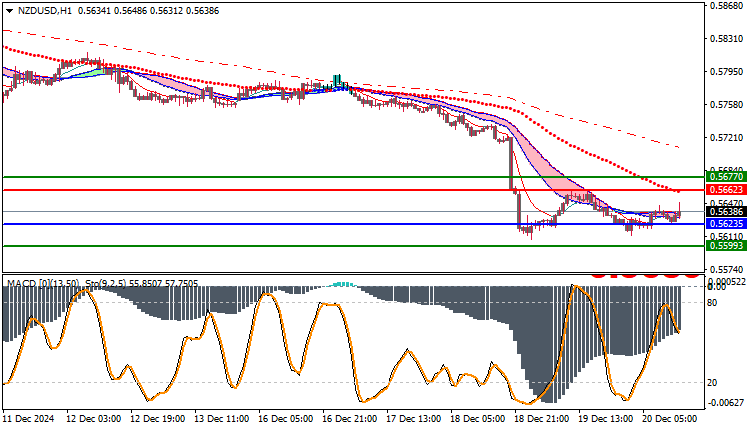
Trading strategies based on Buy/Sell levels
| NZDUSD | In case of buying | in case of selling |
| Entry point | 0.5662 | 0.5623 |
| Target Point 1 (TP1) | First resistance: 0.5677 | First support: 0.5599 |
| Target Point 2 (TP2) | Second resistance: 0.5687 | Second support: 0.5572 |
| Stop Loss (SL) | 0.5623 | 0.5662 |
Based on the current technical analysis, the NZD/USD pair continues its downtrend, with signs of weakening downside strength according to the MACD indicator. If the pair continues to trade below the moving averages, selling pressure on the pair is likely to continue. However, any changes in momentum or economic surprises should be monitored, which could lead to short-term trend fluctuations.


