
The NZDUSD pair opened the third week of this month at $0.6159, and recorded its highest price so far at $0.6198, while the lowest price it reached was $0.6153. Currently, the pair is trading at $0.6187.
Moving Averages and MACD Indicator Signals
The NZDUSD pair is trading above the moving averages’ crossovers, which indicates the continuation of the uptrend. In addition, the MACD indicator shows strong purchasing power, which enhances confidence in the continuation of this trend.
What is the next trend forecast?
Based on the current technical data, where the NZDUSD pair is trading above the moving averages’ crossovers and the MACD indicator is showing purchasing power signals, the uptrend is expected to continue dominating the price action. If the pair manages to surpass the current resistance levels, we may see further gains.
However, traders are advised to watch for any sudden changes in economic or technical factors that may affect the market, as a small correction or pullback is still possible if new signs of weakness appear.
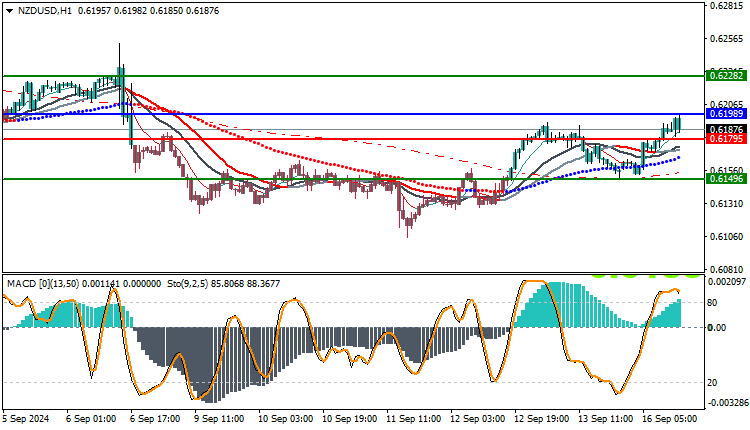
Trading strategies based on Buy/Sell levels
| NZDUSD | In case of buying | in case of selling |
| Entry point | 0.6198 | 0.6179 |
| Target Point 1 (TP1) | First resistance: 0.6228 | First support: 0.6149 |
| Target Point 2 (TP2) | Second resistance: 0.6258 | Second support: 0.6119 |
| Stop Loss (SL) | 0.6179 | 0.6198 |
With the price continuing above the moving average crossovers and the MACD showing positive signals, the uptrend appears strong. These technical signals confirm the presence of strong buying momentum, suggesting that the pair is likely to continue making further gains in the coming days.


