
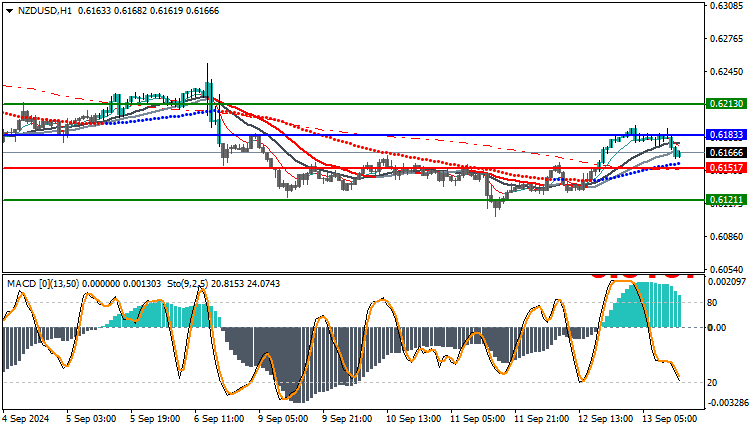
The NZDUSD pair is trading today in an uptrend but is facing some weakness, as the price reached $0.6166. The bulls are trying to control the market, but they are facing strong resistance. If the price is able to break the resistance area at 0.6183, it may open the way for the bulls to take full control of the trend.
NZDUSD Trading Above Moving Averages
The pair is showing positive signs thanks to trading above most of the moving average crossovers, which enhances the chances of continuing the upward trend. This indicates relative stability in the market, but the movement still needs additional momentum to break important resistance levels.
MACD Indicator and Technical Signals
Despite the bullish trend, the MACD indicator is showing weakness in the purchasing power, indicating hesitation among traders about the extent to which the bulls can maintain the current trend. This weakness may be an indication of a possible reversal or price fluctuation if the price is unable to break the resistance soon.
Trading strategies based on Buy/Sell levels
| NZDUSD | In case of buying | in case of selling |
| Entry point | 0.6183 | 0.6151 |
| Target Point 1 (TP1) | First resistance: 0.6213 | First support: 0.6121 |
| Target Point 2 (TP2) | Second resistance: 0.6240 | Second support: 0.6091 |
| Stop Loss (SL) | 0.6151 | 0.6183 |
Based on the current situation, the NZDUSD pair remains in a sensitive position as it could head towards further upside if it manages to break the resistance area. However, with signs of weakness in the purchasing power, traders should carefully monitor the market and follow the signals of technical indicators to determine the appropriate entry and exit points.


